Application Performance Metrics: What to Measure and How to Read Them
by GainHQ Editorial Team | Oct 28, 2026 | Software Development Insights | Editorial policy
Table of Contents
- What are application performance metrics?
- The core application performance metrics, defined
- Golden signals, RED and USE: three ways to choose metrics
- Why averages mislead: a worked example
- Turning metrics into targets: SLIs, SLOs and error budgets
- Which metrics to track by application type
- How to collect and read the metrics
- How to improve application performance using these metrics
- How GainHQ can help
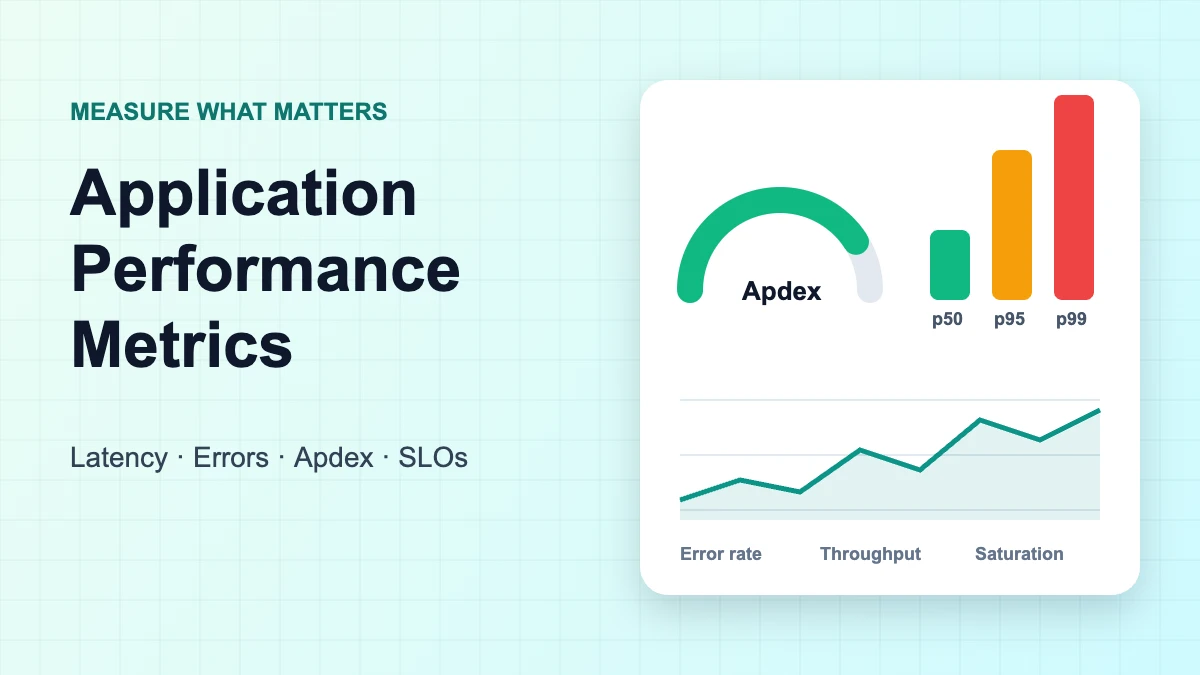
Application performance metrics are the numbers that tell you how fast, how reliable and how close to its limits your software is while real people use it. The short list is latency (as percentiles), traffic, errors and saturation, plus user-facing scores such as Apdex, Core Web Vitals for web front ends and crash rates for mobile apps. This guide gives each metric an exact definition and formula, shows how to read it, and explains how to turn it into targets.
What are application performance metrics?
Application performance metrics are measurements of how an application behaves at runtime: how long requests take, how many it handles, how many fail and how much spare capacity remains. They answer "what is application performance?" in concrete terms, because performance is only meaningful as something you can measure against a target.
APM (application performance monitoring) is the tooling that collects these numbers. Gartner defines APM as "a suite of monitoring software comprising digital experience monitoring (DEM), application discovery, tracing and diagnostics, and purpose-built artificial intelligence for IT operations." You can define and use APM metrics without any particular product.
One distinction saves a lot of confusion. Delivery metrics such as the DORA set (deployment frequency, lead time, change failure rate, recovery time) describe how your team ships software, not how the software performs for users. They are covered in our guides to deployment frequency metrics and engineering KPIs. This article is about runtime performance.
The core application performance metrics, defined
Most teams need six metrics before anything else: latency percentiles, throughput, error rate, saturation, availability and a user-satisfaction score such as Apdex. The table gives a working definition and formula for each, drawn from the Google SRE book, the SRE Workbook and the Apdex specification.
| Metric | Definition | Formula | How to read it |
|---|---|---|---|
| Latency (p50, p95, p99) | Time to serve a request, as a distribution | pN = value below which N% of requests fall | Set targets on percentiles; track failed-request latency separately |
| Traffic / throughput | Demand on the system | Requests (or transactions) ÷ seconds | Read alongside latency; rising latency at flat traffic signals a problem |
| Error rate | Share of requests that fail | Failed requests ÷ total requests | Count explicit (HTTP 5xx), implicit (wrong content) and policy failures (too slow) |
| Saturation | How "full" the most constrained resource is | Varies: CPU %, memory %, queue depth, pool usage | Performance often degrades before 100%, so set a utilisation target |
| Availability | Share of requests (or time) served successfully | Successful requests ÷ total requests | Usually expressed as an SLO such as 99.9% |
| Apdex | User satisfaction with response time, 0 to 1 | (Satisfied + Tolerating ÷ 2) ÷ Total samples | 0.94–1.00 Excellent, 0.85–0.93 Good, 0.70–0.84 Fair |
Latency
Latency is "the time it takes to service a request," in the words of the SRE book. The same source warns that it is "important to distinguish between the latency of successful requests and the latency of failed requests," because a fast HTTP 500 can drag your numbers down and make a broken service look quick. Its advice is to track error latency rather than filter errors out, since "a slow error is even worse than a fast error."
Traffic and throughput
Traffic is "a measure of how much demand is being placed on your system, measured in a high-level system-specific metric." For a web service or API that is usually HTTP requests per second, often split by endpoint or request type. Throughput is the same idea measured as completed work, such as orders processed or jobs finished per minute.
Error rate
Error rate is failed requests divided by total requests over a window. The SRE book counts three kinds of failure: explicit (for example HTTP 500s), implicit ("an HTTP 200 success response, but coupled with the wrong content") and by policy, such as treating any request over a committed one-second response time as an error. Note that a 404 is a client "not found" response, not a server error; whether it counts depends on your definition.
Saturation
Saturation measures how full your service is, with emphasis on the resources that are most constrained, such as memory, I/O, CPU or a connection pool. The SRE book notes that "many systems degrade in performance before they achieve 100% utilization, so having a utilization target is essential," and that "latency increases are often a leading indicator of saturation."
Apdex
Apdex (Application Performance Index) is an open standard that turns many response-time samples into one score between 0 and 1. You choose a target threshold T. Responses up to T are satisfied, responses above T up to F = 4T are tolerating, and anything slower is frustrated. The v1.1 specification adds that detected application errors, such as web page 404 replies, count as frustrated samples whatever their speed, and that scores should be reported with T attached (for example 0.85 with T = 0.3 s), because a score is meaningless without its threshold.
Golden signals, RED and USE: three ways to choose metrics
The four golden signals, the RED method and the USE method are short checklists that stop you measuring everything and missing what matters. Golden signals and RED describe services from the user's side; USE describes the hardware and resources underneath. Most teams use a service checklist plus USE for infrastructure.
| Framework | Origin | Metrics | Applies to | Best for |
|---|---|---|---|---|
| Four golden signals | Google SRE book | Latency, traffic, errors, saturation | User-facing systems | "If you can only measure four metrics of your user-facing system, focus on these four" |
| RED | Tom Wilkie, 2015 | Rate, errors, duration | Each service, especially microservices | A consistent dashboard per service |
| USE | Brendan Gregg | Utilisation, saturation, errors | Every resource (CPU, memory, disks, network) | Finding bottlenecks early in an investigation |
RED is essentially the golden signals without saturation. Wilkie describes RED and USE as "two different views on the same system": RED tells you users are suffering, USE helps explain which resource is the cause.
Why averages mislead: a worked example
Averages hide the slow requests that users actually notice, so production latency should be read as percentiles. The SRE book gives the reason: with "an average latency of 100 ms at 1,000 requests per second, 1% of requests might easily take 5 seconds." The example below shows the effect on a small window of production traffic and scores the same window with Apdex.
Illustrative example (not GainHQ data). A checkout API logs 20 requests in one minute. Response times in milliseconds, sorted: 120, 125, 130, 135, 140, 140, 145, 150, 155, 160, 165, 170, 180, 190, 210, 240, 380, 900, 1,500 and 2,600. The last request was an HTTP 500 after a timeout. Percentiles use the nearest-rank method (rank = ⌈p × n⌉); all arithmetic was computed in Python.
| Statistic | Value | Note |
|---|---|---|
| Mean (all 20) | 396.75 ms | 17 of 20 requests were faster than this |
| Mean (19 successful) | 280.79 ms | Looks healthy once the error is filtered out |
| p50 (rank 10) | 160 ms | The typical request |
| p95 (rank 19) | 1,500 ms | One request in 20 took 1.5 s or longer |
| p99 (rank 20) | 2,600 ms | With only 20 samples, p99 is simply the slowest request |
| Error rate | 1 ÷ 20 = 5% | One failed request in this minute |
Three lessons follow. First, the mean (about 397 ms) describes almost nobody: most users saw around 160 ms, a few waited over a second. Second, dropping the failed request makes the mean look better (about 281 ms), which is exactly why the SRE book says to track error latency rather than filter it out. Third, p99 needs volume: over 20 samples it is just the maximum, so judge p99 over longer windows or higher-traffic endpoints.
Now score the same window with Apdex, using T = 300 ms, so F = 4T = 1,200 ms.
| Zone | Rule | Count |
|---|---|---|
| Satisfied | ≤ 300 ms | 16 |
| Tolerating | > 300 ms and ≤ 1,200 ms | 2 (380, 900) |
| Frustrated | > 1,200 ms, or an error | 2 (1,500, plus the HTTP 500) |
Apdex = (16 + 2 ÷ 2) ÷ 20 = 17 ÷ 20 = 0.85, reported as 0.85 with T = 0.3 s. That sits at the bottom of the spec's "Good" band (0.85–0.93). One more slow request would push it into "Fair," which makes Apdex a useful, easy-to-explain alarm for non-engineers. It still hides which users suffered, so keep percentiles on the engineering dashboard.
Turning metrics into targets: SLIs, SLOs and error budgets
A metric becomes useful when you attach a target to it. The SRE Workbook recommends expressing a service level indicator (SLI) as "the number of good events divided by the total number of events," then setting a service level objective (SLO) on it. The error budget is "100% minus the SLO."
- Availability SLI: successful requests ÷ total requests.
- Latency SLI: requests faster than a threshold ÷ total requests. The Workbook suggests several thresholds so the tail is covered, for example "90% of requests are faster than 100 ms, and 99% of requests are faster than 400 ms."
Illustrative example (not GainHQ data). A service with a 99.9% availability SLO receives 2,000,000 requests in 30 days. Its error budget is 0.1% of that, or 2,000 failed requests. An incident that causes 1,200 failures uses 60% of the month's budget. If you measure availability by time instead, 0.1% of a 30-day month is 43.2 minutes of downtime.
Error budgets turn a metric into a decision rule: while budget remains, the team ships; when it runs out, reliability work comes first. Our guide to site reliability engineering for SaaS covers how teams run that process.
Which metrics to track by application type
The right metric set depends on what the application is and where users feel delay. A backend API is judged on latency and errors per request, a web front end on what the browser renders, and a mobile app on stability on real devices. Start with the column that matches your app, then add the golden signals for its backend.
| App type | Primary metrics | Published reference targets |
|---|---|---|
| Web application (front end) | Core Web Vitals: LCP, INP, CLS | Good = LCP ≤ 2.5 s, INP ≤ 200 ms, CLS ≤ 0.1, at the 75th percentile of page loads |
| API or backend service | p50/p95/p99 latency, request rate, error rate, saturation | Set your own SLOs; no universal standard |
| Mobile app (Android) | User-perceived crash rate, user-perceived ANR rate, startup time | Bad behaviour thresholds: crash rate 1.09% overall, 8% per phone model; ANR rate 0.47% overall, 8% per phone model |
| Background jobs and queues | Queue depth, job age or wait time, processing rate, failure rate | Set against business deadlines (e.g. "invoices sent within 5 minutes") |
| Databases and caches | Query latency percentiles, connection pool usage, cache hit ratio | USE method on each resource |
For web application performance metrics, note the measurement rule as well as the thresholds: Google evaluates Core Web Vitals at the 75th percentile of real page loads, segmented by mobile and desktop. For INP, web.dev classes more than 500 ms as poor. For Android, Play Console defines user-perceived crash rate as "the percentage of your daily active users who experienced at least one crash while they were actively using your app," and Play may reduce an app's visibility if it exceeds a bad behaviour threshold. An ANR is triggered when, among other conditions, the app has not responded to an input event within 5 seconds.
How to collect and read the metrics
Collect latency as a histogram, not as pre-computed averages, so percentiles can be calculated for any group of servers or time window. This is also what the open standard now specifies. OpenTelemetry's HTTP semantic conventions define http.server.request.duration as a stable histogram measured in seconds, with recommended bucket boundaries from 0.005 s to 10 s, and attributes such as http.request.method, http.route and http.response.status_code.
Histograms matter because percentiles do not add up: you cannot average the p95 of three servers to get the p95 of the service, but you can merge their histograms and compute it. The SRE book makes the same recommendation, to "collect request counts bucketed by latencies" and suggests watching the 99th percentile over a short window (for example one minute) as an early signal of saturation.
A few reading habits keep dashboards honest:
- Put latency, traffic and errors on the same time axis, so a latency rise can be matched to a traffic spike or an error burst.
- Break metrics down by route or endpoint; a healthy average across all endpoints can hide one slow checkout call.
- Alert on SLO burn and user-facing symptoms; use resource (USE) metrics for diagnosis rather than paging.
Open-source stacks built on OpenTelemetry and commercial APM platforms can all compute these metrics; what matters is that they store histograms, keep failed-request latency and support SLOs. Our roundup of SaaS monitoring tools compares options, and our guide to software observability explains how metrics fit with logs and traces.
How to improve application performance using these metrics
To improve application performance, use the metrics to find the constraint first, then fix it and confirm the change in the same percentiles. Start from the worst SLO, find the slowest routes at p95 and p99, and check the USE metrics of the resources they depend on.
The fixes themselves, such as caching, query tuning, asynchronous processing and scaling, are covered in our guide to SaaS performance optimization. To check a fix before it reaches production, load-test against the same percentile targets; our guide to software performance testing explains how.
How GainHQ can help
GainHQ is a custom software development company with 15+ years of experience building software, 13+ products delivered and a team of 30+. We also build our own products, Payrun (HR and payroll) and Gain.io (CRM and helpdesk). If you need help defining SLIs and SLOs, adding OpenTelemetry instrumentation or fixing a slow service, see our services.
Frequently asked questions
What are application performance metrics?
Application performance metrics are runtime measurements of how software behaves for users: response-time percentiles, request rate, error rate, saturation of key resources and availability. User-facing scores such as Apdex, Core Web Vitals and mobile crash rates complete the picture. They differ from delivery metrics, which measure how a team ships code.
What are examples of performance metrics?
Common examples are p95 and p99 latency, requests per second, error rate, CPU or memory utilisation, queue depth, availability percentage and Apdex. For web front ends, Largest Contentful Paint, Interaction to Next Paint and Cumulative Layout Shift; for Android apps, user-perceived crash and ANR rates.
What are the four golden signals?
The four golden signals, from Google's Site Reliability Engineering book, are latency, traffic, errors and saturation. Google's advice is that if you can only measure four metrics of a user-facing system, these are the four. RED (rate, errors, duration) is a close variant without saturation.
What is a good Apdex score?
The Apdex specification rates 0.94–1.00 as Excellent, 0.85–0.93 as Good, 0.70–0.84 as Fair, 0.50–0.69 as Poor and below 0.50 as Unacceptable. A score only means something alongside its threshold T, so always report it with T, for example 0.85 with T = 0.3 s.
Why use p95 or p99 instead of average response time?
Averages hide slow outliers. A few very slow requests can raise the mean while most users see fast responses, or a cluster of fast errors can make it look healthier than it is. Percentiles show what the slowest 5% or 1% of users actually experience, which is where complaints come from.
What is the difference between APM and BPM?
APM (application performance monitoring) measures how software performs: latency, errors, throughput and resource use. BPM usually refers to business process management or monitoring, which tracks whether business workflows such as orders or approvals complete correctly and on time. Teams often link the two so slow code can be tied to business impact.
Are DORA metrics application performance metrics?
No. DORA metrics such as deployment frequency, lead time for changes and change failure rate measure software delivery performance, meaning how a team ships. Application performance metrics measure how the running software behaves for users. Both matter, but they answer different questions. See our guide to engineering KPIs.
What are APM tools?
APM tools collect, store and visualise application performance metrics, usually alongside traces and logs, and alert when targets are missed. Options range from open-source stacks built on OpenTelemetry to commercial platforms. Choose one that stores latency histograms and supports SLOs; our SaaS monitoring tools guide compares options.