
What Is The SaaS Magic Number? Calculations, Formulas, And Benchmarks

by Rhea Collins | Aug 11, 2026
Table of Contents
- What Is The SaaS Magic Number
- How To Calculate The SaaS Magic Number
- How To Interpret Your Magic Number Score
- Magic Number Benchmarks By Company Stage
- Why Quarterly Numbers Mislead Early Stage Startups
- Limitations Of The Magic Number
- Magic Number vs Other SaaS Efficiency Metrics
- Why Clean Pipeline Data Drives Accuracy
- Five Decisions Your Magic Number Should Drive
- Best Practices To Improve Your Magic Number
- Final Thoughts
Every SaaS founder eventually stares at a board deck slide asking why growth feels expensive. Sales and marketing spend keeps climbing, but nobody can say for sure if that spend is paying off. Scale Venture Partners built the magic number to answer exactly that question in one clean ratio. It takes your quarterly revenue growth, annualizes it, and divides it by what you spent to get there.
A single number tells you whether your go-to-market engine deserves more fuel or needs a hard look. Investors watch it. Boards ask about it. Yet most founders calculate it once, glance at the result, and move on without understanding what drives it up or down. Here's the full breakdown of the SaaS magic number: the formula, real benchmarks by stage, and what to actually do once you know your number.
What Is The SaaS Magic Number
The SaaS magic number measures sales efficiency. It shows how much new revenue your company earns for every dollar spent on sales and marketing expenses. A higher number means your marketing efforts and sales team are converting spend into growth without waste, supporting sustainable SaaS scalability strategies. A lower number often signals rising customer acquisition costs or a sales motion that needs work. The formula also captures revenue from existing customers, not just new logos. That makes it a fast, honest check on whether your growth spend is actually working.
How To Calculate The SaaS Magic Number
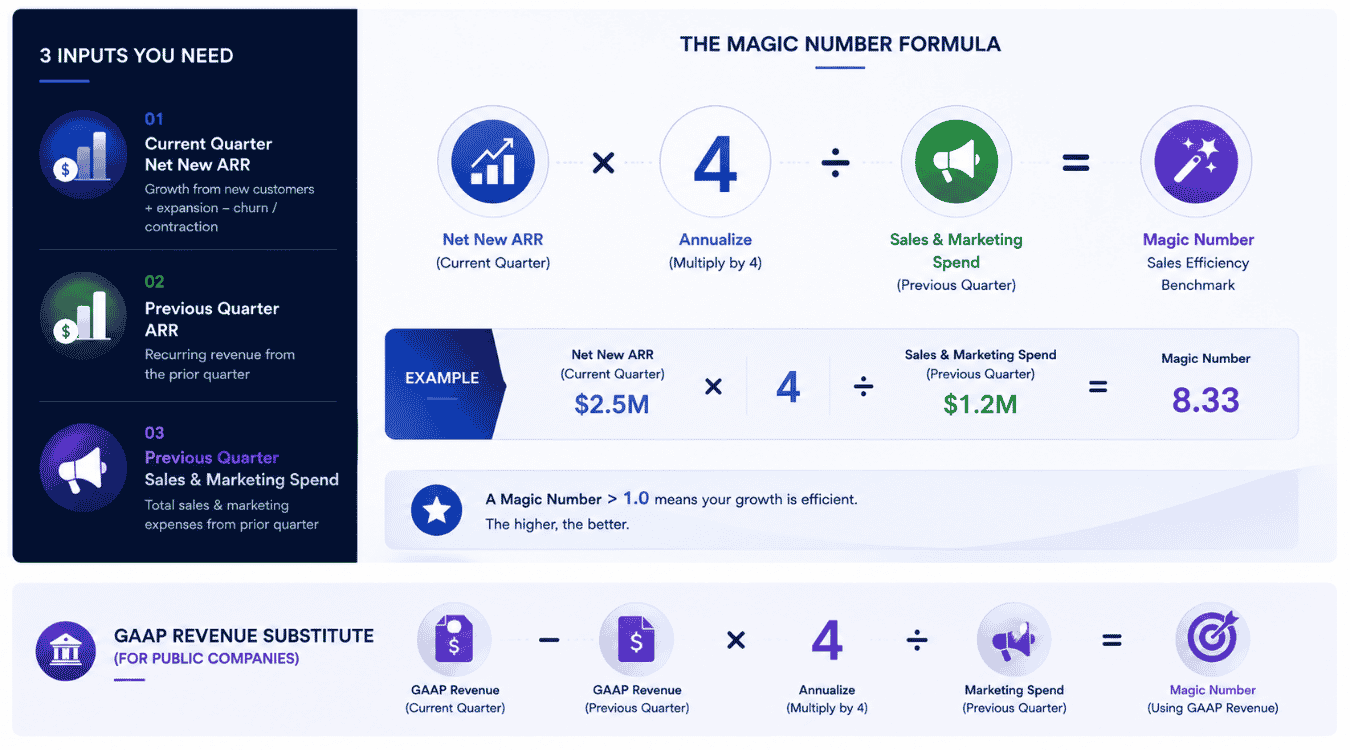
Calculating the magic number takes only three inputs: two quarters of recurring revenue and one quarter of spend. From there, net new ARR and the GAAP substitute both build naturally on the same math.
The Magic Number Formula
The formula is simple: take your current quarter's revenue growth, multiply it by four to annualize it, then divide by the previous quarter's sales and marketing investment. That single calculation turns two numbers into one of the most watched sales efficiency metrics in SaaS.
Multiplying by four matters because one quarter alone understates the real trend. Annualizing shows what your marketing and sales efforts would produce over a full year at the current pace, which is the number investors and boards actually use for comparison.
Breaking Down Net New ARR
Net new ARR is the growth number behind the formula. Start with recurring revenue from new customers, add expansion revenue from upsells, then subtract revenue lost to churn or downgrades. Improving retention through a stronger user experience that reduces SaaS churn directly lifts this number. What remains is the true increase in recurring revenue for the quarter.
This distinction matters because customer acquisition alone doesn't tell the full story. A company can sign new logos while losing just as much from existing accounts, and net new ARR catches that gap before it quietly drags your magic number down.
GAAP Revenue Substitute For Public Companies
Net new ARR works well when you have internal access to the numbers. Public companies rarely disclose ARR, so analysts substitute GAAP revenue instead. The formula becomes current quarter revenue minus the previous quarter's sales, multiplied by four, then divided by prior quarter marketing expenses.
The substitution isn't perfect since GAAP revenue includes services and other line items beyond subscriptions. But it gives investors a workable estimate when public financial statements are the only numbers available for comparison.
Step-by-Step Calculation Example
Take a company with $500,000 in recurring revenue last quarter and $650,000 this quarter. That's $150,000 in new revenue, annualized to $600,000 by multiplying by four. If last quarter's sales and marketing spend was $500,000, divide $600,000 by $500,000.
Here's the full math laid out step by step:
Current quarter recurring revenue: $650,000
Previous quarter recurring revenue: $500,000
Revenue growth: $650,000 − $500,000 = $150,000
Annualized growth: $150,000 × 4 = $600,000
Previous quarter sales and marketing spend: $500,000
Magic Number: $600,000 ÷ $500,000 = 1.2
The result is 1.2. That means for every dollar spent on sales and marketing, the company generated $1.20 in annualized recurring revenue. Anything above 1.0 signals an efficient growth engine, so this business could reasonably justify increasing its marketing investment next quarter.
How To Interpret Your Magic Number Score
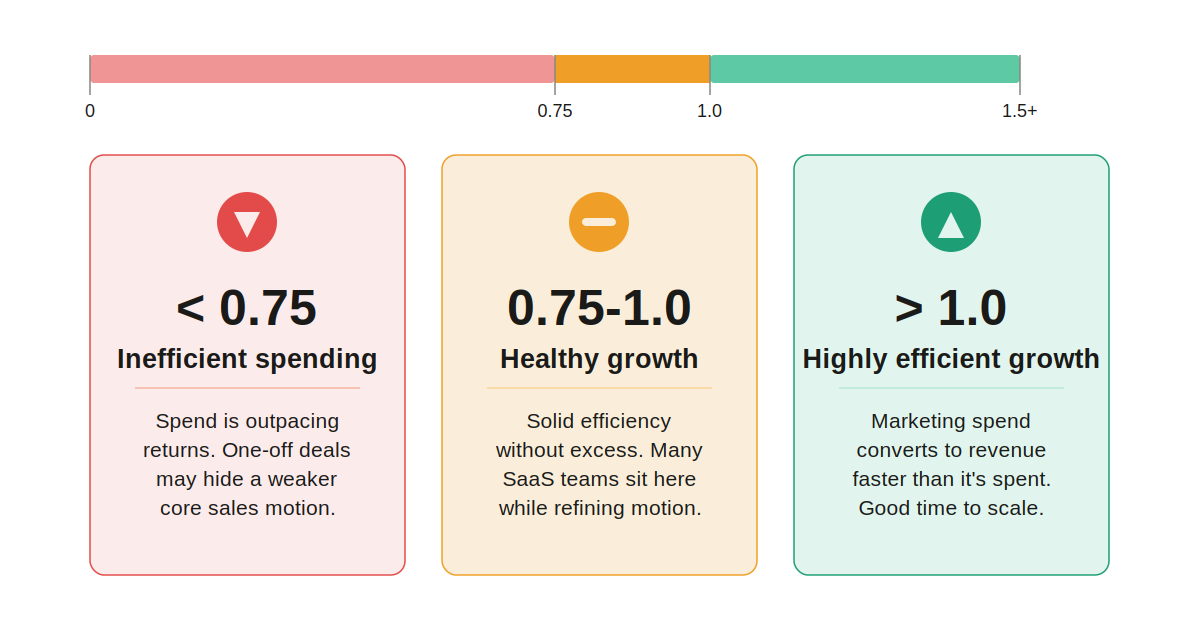
Once you have your score, the real question is what it actually means for your business and whether your current pace is worth defending or fixing.
Above 1.0: Highly Efficient Growth
A score above 1.0 signals strong net sales efficiency. Most SaaS companies at this level are converting marketing spend into revenue faster than they're spending it. This is the range where increasing sales and marketing investment usually makes sense, since the SaaS magic number formula shows real returns on every dollar.
Between 0.75 And 1.0: Healthy Growth
This range reflects solid gross sales efficiency without excess. A company's sales efficiency here is generally healthy, though not exceptional. Marketing efficiency may still have room to improve. Many SaaS companies sit comfortably in this band while refining their motion before pushing spend higher.
Below 0.75: Inefficient Spending
A score below 0.75 means it's harder to measure sales efficiency in a positive light. Spend is outpacing returns, and professional services revenue or one-off deals may be masking a weaker core motion. This range usually calls for a pause and a closer look at what's driving the gap.
Magic Number Benchmarks By Company Stage
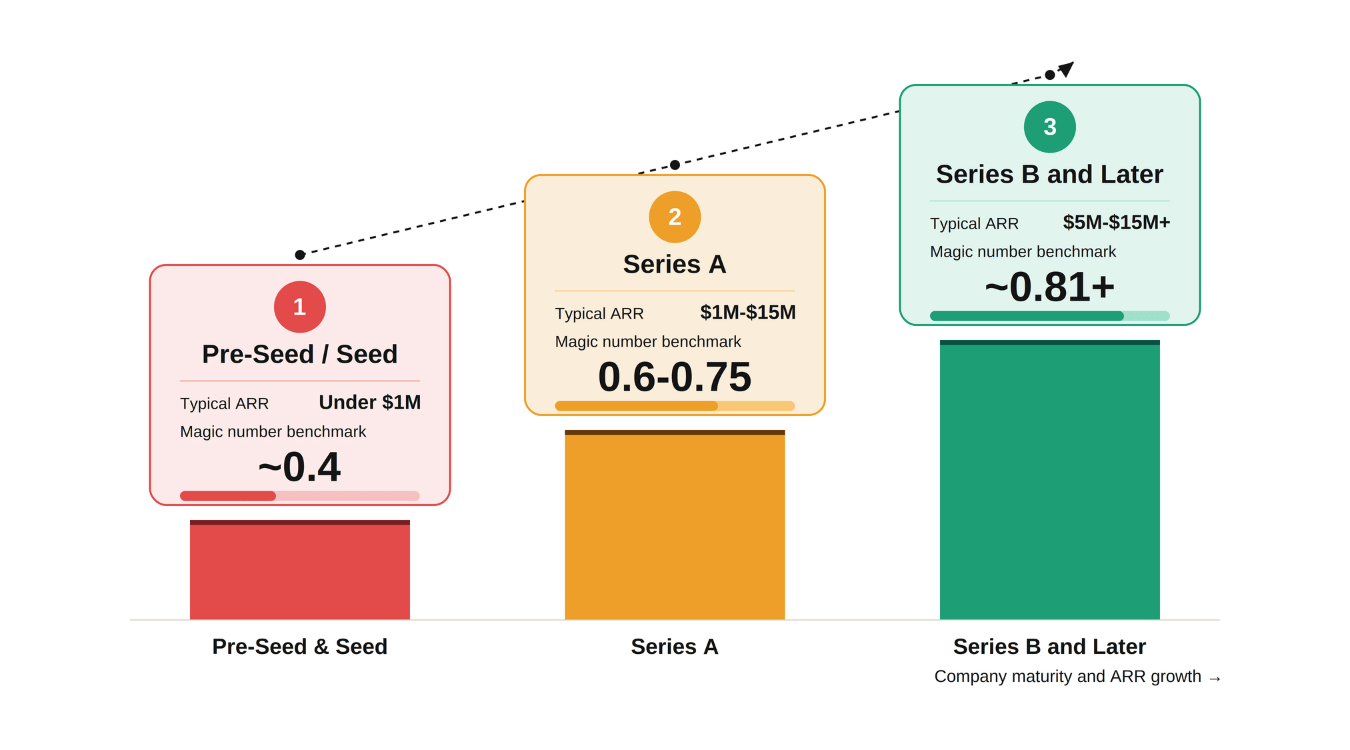
Flat thresholds don't hold up once you compare stages. A seed-stage saas business and a Series B company face very different sales efforts, and the saas magic number benchmarks below reflect that gap.
Stage | Typical ARR | Magic Number Benchmark |
|---|---|---|
Pre-Seed / Seed | Under $1M ARR | ~0.4 |
Series A | $1M–$15M ARR | 0.6–0.75 |
Series B and later | $5M–$15M+ ARR | ~0.81+ |
Pre Seed And Seed Benchmarks
At this stage, most saas businesses are still proving their sales process works at all. A magic number near 0.4 is common and not necessarily a red flag, since early marketing costs often fund infrastructure that won't convert for a few quarters.
Founder-led sales and a small sales team mean each new customer moves the number more than it would at scale. Focus on customer lifetime value and repeatability before judging efficiency too harshly here.
Series A Benchmarks
Series A companies are expected to show early signs of a repeatable motion. A score between 0.6 and 0.75 is generally acceptable while the ideal customer profile and sales efforts are still being refined.
Investors watch whether incremental recurring revenue is growing faster than marketing costs. A dedicated sales team beginning to hit quota, alongside rising annual recurring revenue, matters more here than hitting 1.0 on paper.
Series B And Later Benchmarks
By Series B, the bar rises. A median near 0.81 reflects sales teams that have moved past founder-led selling and built demand generation with measurable returns from new customers, usually on top of a mature SaaS product development lifecycle.
At this stage, using the current quarter's GAAP revenue as a stand-in for ARR becomes more common for public comparisons. Each dollar spent should produce clearer, more predictable incremental recurring revenue than it did at Series A, which also makes accurate SaaS development cost planning more critical.
Why Quarterly Numbers Mislead Early Stage Startups
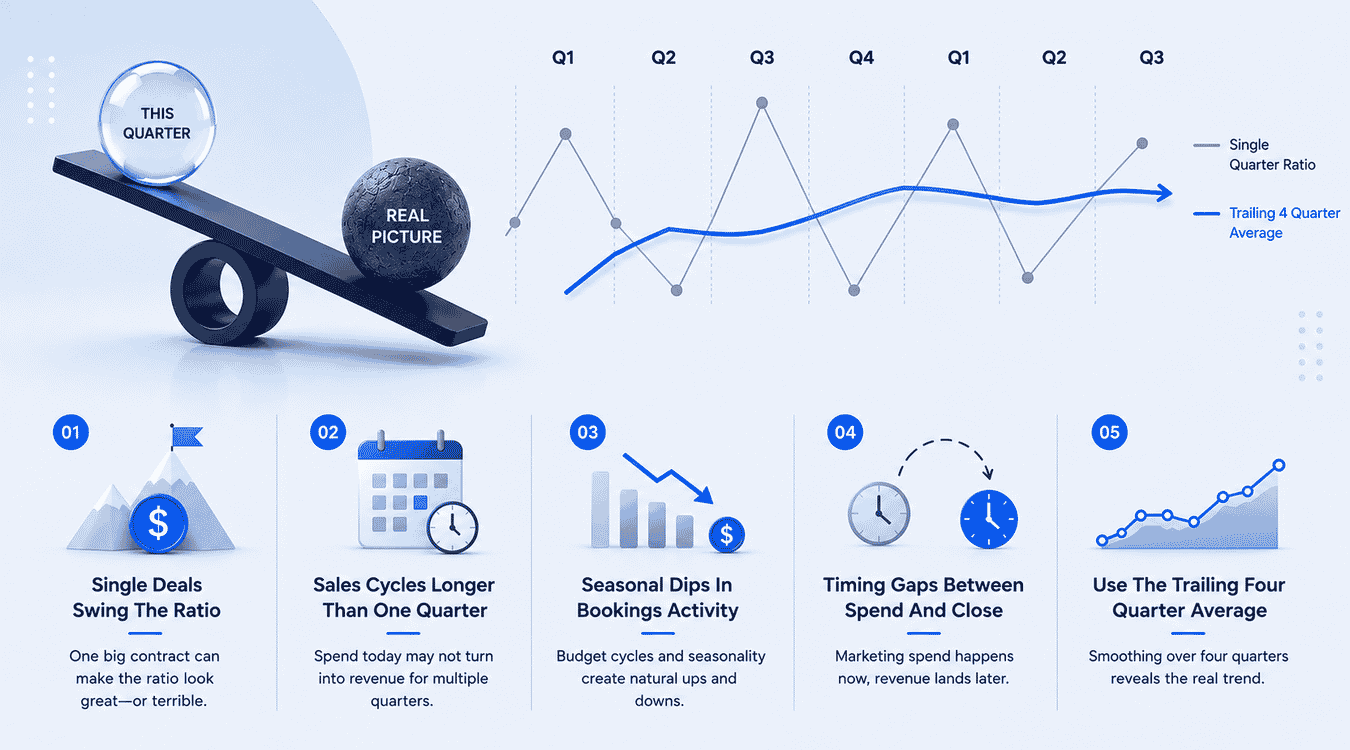
A single quarter rarely tells the full story for young startups. Small sample sizes, timing quirks, and uneven deal flow can all distort the numbers before real patterns even emerge, as many successful SaaS launch case studies show when early growth looks noisy before it compounds.
Single Deals Swinging The Ratio
Early on, one large contract can carry an entire quarter's new revenue. If a company's sales team closes one deal worth $200,000, total revenue jumps sharply even though the underlying motion hasn't changed. That single deal can generate revenue that makes the ratio look far stronger, or weaker, than it actually is.
Sales Cycles Longer Than One Quarter
Many B2B deals take multiple quarters to close. Marketing spend booked this quarter might not drive revenue growth until two quarters later. In the business world of enterprise sales, this mismatch means the quarter's ratio measures spend against revenue that hasn't arrived yet, understating true performance.
Seasonal Dips In Bookings Activity
Budget cycles, holidays, and fiscal year timing all affect new customer acquisition unevenly across the year. A slow Q1 followed by a strong Q4 doesn't mean efficiency actually changed. It often just reflects when buyers in the existing customer base and prospect pool are ready to sign.
Timing Gaps Between Spend And Close
Marketing spend happens upfront, but the revenue generated from that spend lands later. This lag is one of the same cac payback period factors that make single-quarter snapshots unreliable. Spend this quarter often pays off next quarter, or the one after that.
Using The Trailing Four Quarter Average
Smoothing the ratio over four quarters filters out the noise from any one unusual period. This approach captures a fuller picture of how a saas business is performing, factoring in both new revenue and expansion from the existing customer base over time.
Limitations Of The Magic Number
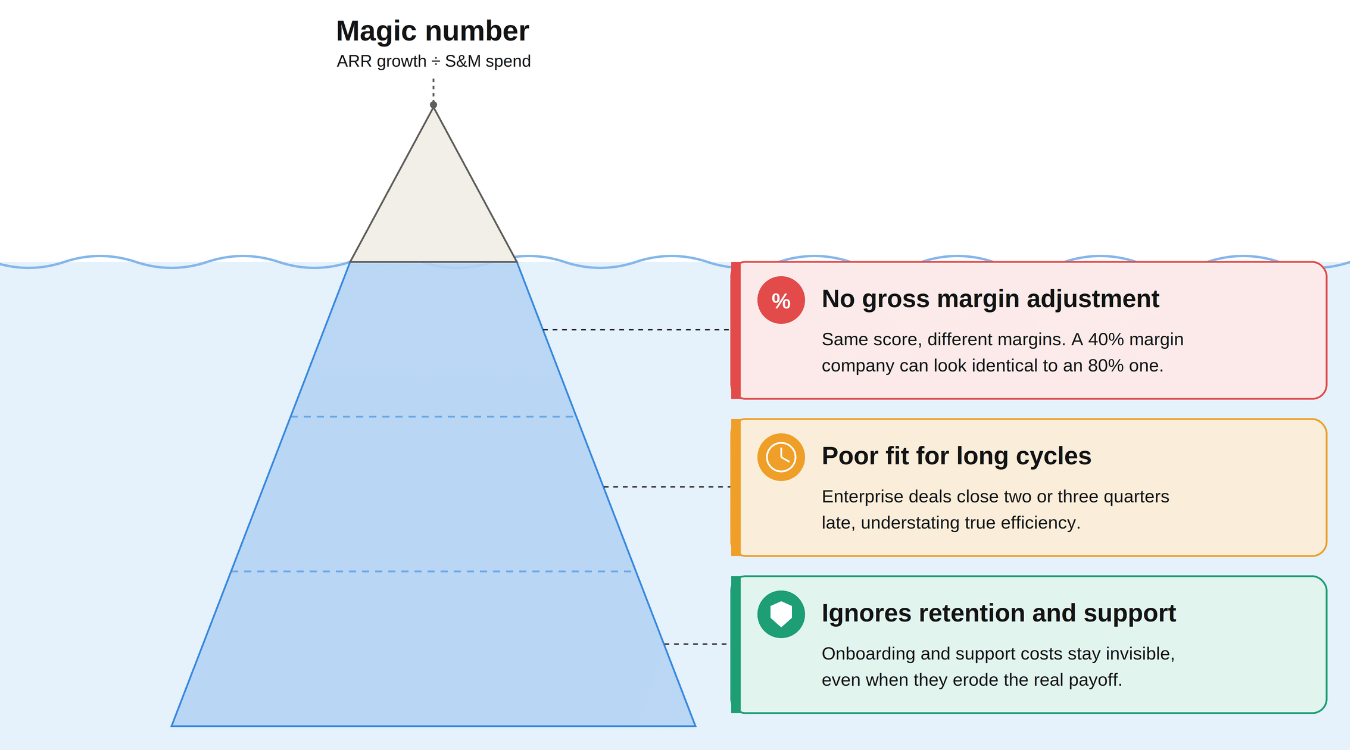
The magic number is useful, but it isn't a complete picture. A few blind spots matter enough that no one should lean on this ratio alone.
No Gross Margin Adjustment
The formula compares current quarter revenue growth against the previous quarter's spend, but it never touches gross margin. Two companies can post the same score while one delivers that revenue at 80% margin and the other at 40%. That gap matters for any business model built on thin delivery costs, since a strong ratio can mask weak underlying profitability.
Poor Fit For Long Enterprise Cycles
Companies with longer sales cycles run into a timing mismatch. Spend lands in one quarter, but the deal might not close for two or three more. This makes the magic number important mostly for businesses with faster sales motions, not necessarily bad, but it explains why enterprise-heavy companies often see numbers that look weaker than their actual trajectory.
Ignores Retention And Support Costs
The ratio only counts sales and marketing spend. It leaves out what it costs to support customers after they sign, which affects customer lifetime and overall sustainable growth. A company can post a great score while quietly overspending on onboarding or support, costs that don't show up here but still shape whether the business model holds up.
Magic Number vs Other SaaS Efficiency Metrics
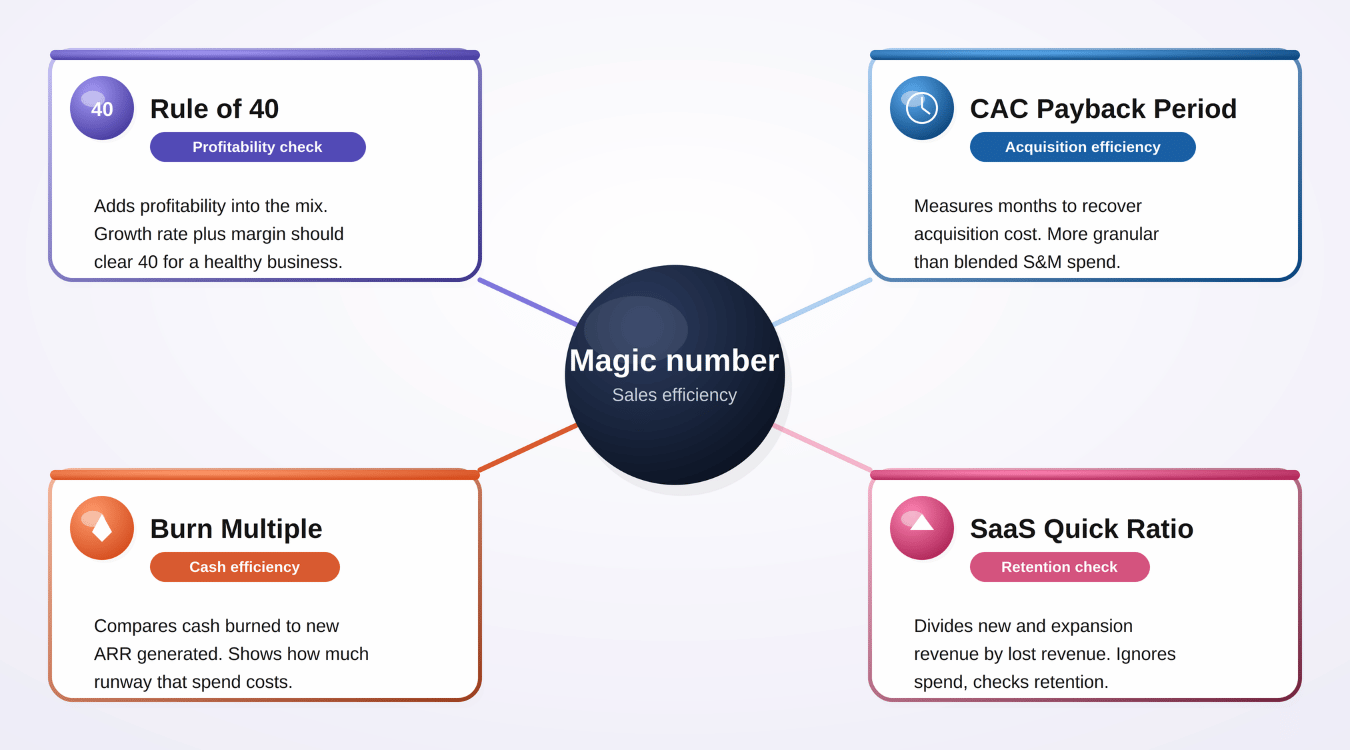
The magic number doesn't work in isolation. Pairing it with a few other metrics from the same period gives a fuller, more valuable insights into how a company is actually growing, especially as AI becomes a bigger part of SaaS products and go-to-market motions; an area where understanding AI in SaaS benefits, challenges, and trends helps you interpret efficiency metrics in context.
Rule Of 40
Rule of 40 adds profitability into the mix. It combines revenue growth rate with profit margin, and the combined score should clear 40 for a healthy SaaS business. Where the magic number greater than 1.0 shows sales efficiency alone, Rule of 40 checks whether that growth is happening without burning too much cash to get there.
CAC Payback Period
CAC payback period measures how many months it takes to recover what was spent to acquire a customer. It's more granular than the magic number since it isolates customer acquisition costs specifically, rather than blending them with broader marketing spend. A good SaaS magic number and a fast payback period together suggest a genuinely efficient growth engine.
Burn Multiple
Burn multiple compares cash burned against new ARR generated in the same period. It answers a slightly different question than the magic number: not just how efficient the spend is, but how much runway that spend costs. Lower burn multiples increase revenue confidence for investors watching long term value.
SaaS Quick Ratio
SaaS quick ratio looks at growth and churn together, dividing new and expansion revenue by lost revenue. It doesn't touch spend at all, which makes it a useful check on whether the revenue behind a strong magic number is actually sticking around or quietly leaking out the back, especially when evaluated alongside the health of your underlying SaaS infrastructure components and architecture.
Why Clean Pipeline Data Drives Accuracy
Every formula in this article assumes clean inputs. In practice, the numbers behind net new ARR and sales and marketing spend are only as reliable as the CRM data feeding them, and most teams don't realize how much that data has already drifted.
Misclassified Expansion Revenue As New
Sales reps often log an upsell or a renewal with an upgrade as a brand new deal instead of expansion revenue. This inflates new customer acquisition numbers while understating the expansion side of net new ARR. The magic number still calculates fine on paper, but it's measuring a distorted mix of where the growth actually came from. At GainHQ, we built Gain.io CRM to separate new business and expansion pipelines from the start, so this kind of misclassification doesn't quietly work its way into quarterly reporting.
Churn Timing Lag In CRM Records
Churn rarely gets logged the day it happens. A customer might stop paying weeks before anyone updates the CRM to reflect it, which means the current quarter's numbers still count revenue that's already gone. This lag can make a quarter look stronger than it really was, only for the correction to hit the next one. Gain.io CRM timestamps status changes as they happen, which keeps churn reporting closer to real time instead of catching up after the fact.
Duplicate Deals Inflating ARR Growth
Duplicate deal records are common when multiple reps touch the same account or when a deal gets re-entered after a stalled negotiation restarts. Each duplicate inflates ARR growth without representing real incremental revenue. Since the magic number formula leans entirely on accurate ARR figures, even a handful of duplicates can shift the ratio enough to misread sales efficiency for the quarter.
Inconsistent Sales And Marketing Spend Tagging
Spend tracking has its own version of this problem. Marketing costs get tagged inconsistently across campaigns, tools, and teams, so the denominator in the formula ends up incomplete or double-counted. A campaign spanning two quarters might get logged entirely in one, throwing off the timing the formula depends on to match spend against the revenue it eventually produces.
Stale Data From Manual Entry
Manual entry is where most of these problems start. Reps update records when they remember to, not necessarily when a deal status actually changes, which leaves stale data sitting in the pipeline for days or weeks. Gain.io CRM reduces this gap through automated deal-stage tracking, giving teams a pipeline view that reflects what's actually happening rather than what was last typed in, which is especially valuable for companies relying on scalable SaaS tools that power global business growth.
Five Decisions Your Magic Number Should Drive
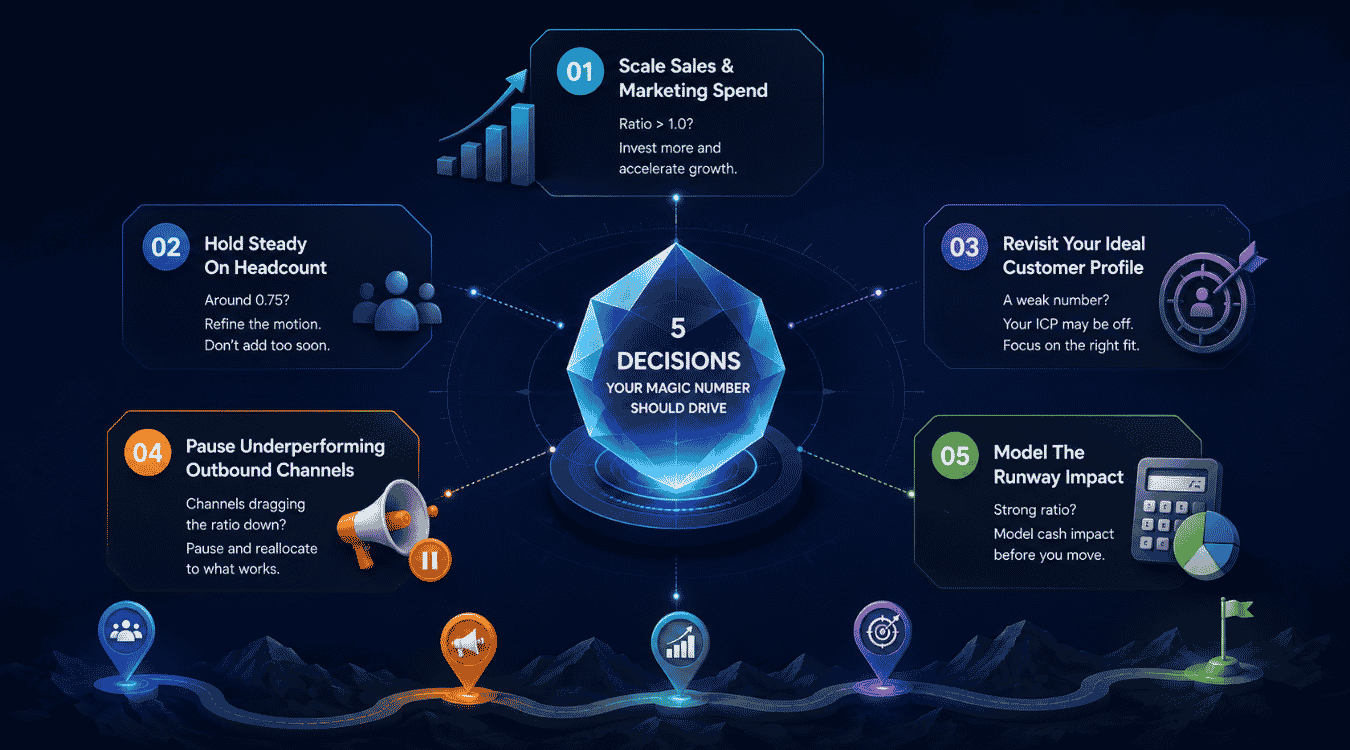
A magic number is a crucial metric, but only if it actually changes what you do next. Here are five decisions it should inform, not just a number for the board deck.
Decision 1: Scale Sales And Marketing Spend
When the ratio sits above 1.0 consistently, general rules suggest it's time to scale spend. Total sales are converting efficiently, and more revenue is following the investment rather than lagging behind it. This is the moment to add budget, not sit on a good number and wait.
Decision 2: Hold Steady On Headcount
A score hovering near 0.75 signals growth potential without a clear green light to scale. Holding headcount steady while the sales motion tightens up is often the safer call here. Adding a bigger team on unproven efficiency usually just delays finding out whether the motion actually works, and a focused SaaS technical audit can often reveal structural issues before you add more people.
Decision 3: Revisit Your Ideal Customer Profile
A weak or declining number often points to who's being sold to, not just how. If churned customers cluster around a specific segment, that's a sign the ideal customer profile needs a second look. Chasing more revenue from the wrong accounts rarely fixes the underlying ratio.
Decision 4: Pause Underperforming Outbound Channels
Content marketing and outbound often get funded from the same budget, and one usually outperforms the other. If a channel keeps dragging the ratio down quarter after quarter, pausing it and reallocating that spend elsewhere is a more useful response than waiting for it to improve on its own.
Decision 5: Model The Runway Impact
Before increasing or cutting spend based on this number, model what it does to runway. A strong ratio can justify faster spending, but only if the cash to support it actually holds up over the next few quarters without forcing a rushed raise.
Best Practices To Improve Your Magic Number

A weak magic number isn't permanent. These five levers are where most SaaS teams see the fastest movement once they know where to look.
Tighten Your Ideal Customer Profile
Selling to the wrong accounts is one of the most common drags on efficiency. Deals that close fast but churn within a few months quietly erase the revenue they briefly added. Look at your best customers by retention and expansion, not just deal size, and use that pattern to narrow who your sales team actually pursues. Aligning those choices with a clear SaaS product roadmap keeps sales, product, and marketing focused on the same segments. A tighter ideal customer profile means less wasted effort chasing prospects who were never going to stick around, which shows up directly in a healthier ratio over time.
Shorten Sales Cycle Length
Every extra week a deal sits in the pipeline delays the revenue that spend was meant to produce. Shortening the cycle means that spend converts to recognized revenue faster, which improves how the formula reads in the same quarter it was spent. Look at where deals actually stall, whether it's procurement, legal review, or a slow internal approval process, and fix the specific bottleneck instead of just pushing reps to move faster across the board; AI-powered experiences, like AI features that increased engagement by 34%, can also guide users through key workflows faster.
Invest In Customer Expansion Revenue
New customer acquisition isn't the only lever here. Expansion revenue from upsells and upgrades counts toward net new ARR without requiring the same marketing spend that new logos demand. A modest investment in customer success or account management often produces a better return than another round of top-of-funnel spend, especially when paired with AI-driven automation in SaaS that scales personalized outreach and adoption. Since existing customers already trust the product, they need less convincing to expand.
Reduce Wasted Marketing Spend
Not every campaign contributes equally to the number. Some channels generate real pipeline, while others burn budget without producing much beyond impressions. Auditing spend by channel and cutting what isn't converting frees up budget for what actually works, and it directly shrinks the denominator in the formula without touching revenue at all; mirroring broader SaaS performance optimization best practices that focus resources where they have the most impact.
Review The Metric Every Quarter
A single good quarter doesn't mean the work is done, and a single bad one doesn't mean the model is broken. Reviewing the ratio every quarter, alongside the trailing average, keeps the team focused on the trend instead of reacting to noise. Regular review also makes it easier to catch a slipping number early, while there's still time to adjust spend or pipeline before it compounds into a bigger problem.
Final Thoughts
The magic number won't tell you everything about your business, but it's one of the fastest ways to check if growth is actually paying for itself. Pair it with Rule of 40, CAC payback, and NRR for the full picture, and always read it against your stage instead of a flat benchmark.
None of it matters much if the data feeding it is messy. Clean pipeline tracking, accurate churn timestamps, and consistent spend tagging turn this from a vanity metric into something you can actually act on every quarter; and those same disciplines support robust SaaS architecture best practices and maintain a consistent SaaS design system for scalable products.