
8 Developer Experience Metrics For Better Engineering Productivity
.jpg)
by Daniel Wright | Aug 17, 2026 | Software Development Insights
Table of Contents
- What Are Developer Experience Metrics
- Why Developer Experience Metrics Are Important
- 8 Developer Experience Metrics You Should Track
- How To Choose The Right Developer Experience Metrics
- How To Combine Quantitative And Qualitative DevEx Metrics
- How To Turn Developer Experience Metrics Into Action
- Common Developer Experience Measurement Mistakes To Avoid
- How AI Changes Developer Experience Measurement
- Final Thoughts
Engineering leaders love to talk about developer productivity. Fewer talk about what actually drives it. Feedback loops, cognitive load, and flow state shape how developers work every single day, yet most teams still measure output instead of experience.
Developer experience metrics fix that gap. They show where friction slows a team down, where tools create more noise than value, and where good developers quietly burn out. Numbers alone don't tell the full story, though. Real insight comes from pairing data with how developers actually feel.
Teams that get this right see real payoff. Positive developer experience makes a team 33% more likely to hit its business goals. That single number explains why DevEx metrics deserve a seat at the leadership table.
What Are Developer Experience Metrics
Developer experience metrics measure how developers actually work, not just what they produce. They look at feedback loops, cognitive load, and flow state instead of raw output. Traditional metrics count lines of code or story points. DevEx metrics ask a better question: how easy is it to do good work here?
Engineering leaders use these metrics to spot friction before it slows software development down. A slow build, a confusing codebase, constant context switching, all of it shows up in the data. But quantitative data only tells half the story. Real developer experience metrics combine numbers with how developers actually feel day-to-day.
Good measurement systems evaluate the environment developers work in, not individual developers themselves. That distinction matters. Track the system, and you get insight. Track the person, and you get gaming behavior instead of real developer productivity.
Why Developer Experience Metrics Are Important
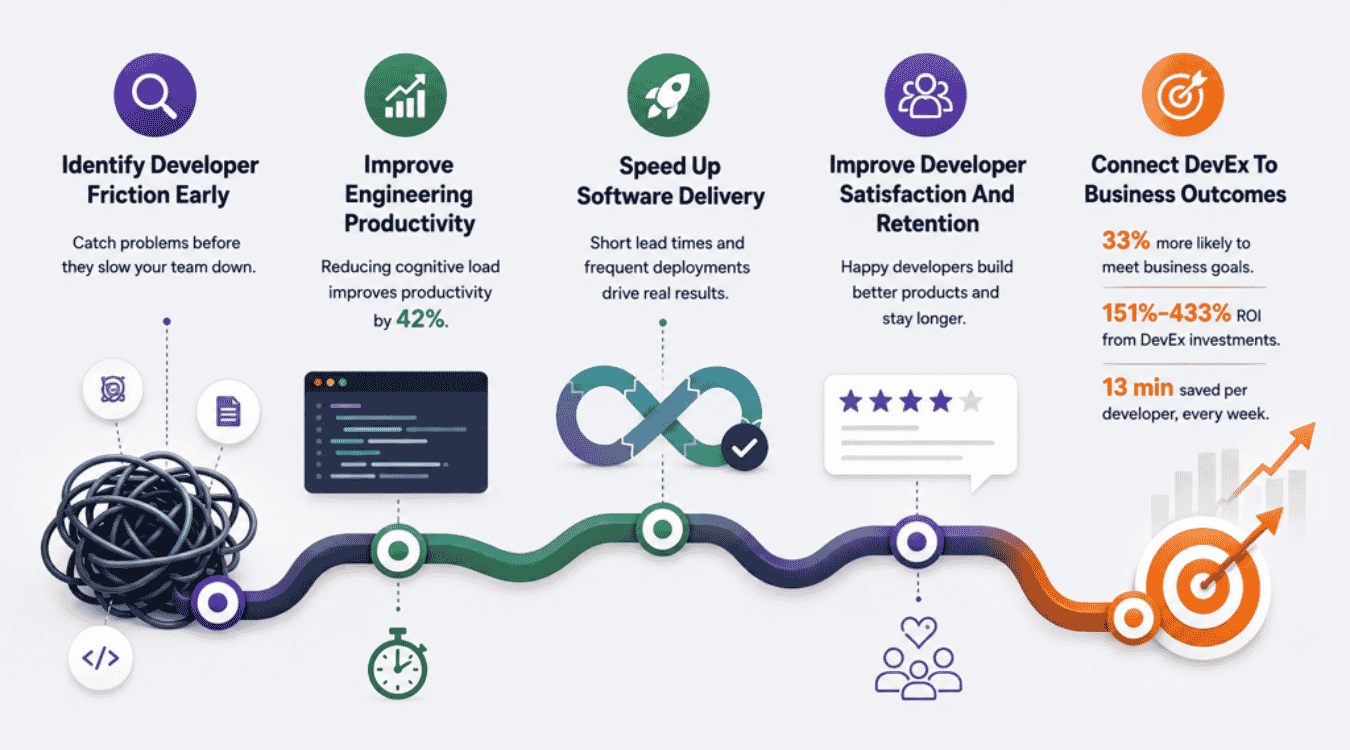
Good code alone doesn't guarantee a healthy engineering organization. Friction hides in daily workflows, slows software delivery, and drains developer satisfaction. Tracking the right metrics turns that hidden friction into something you can actually fix.
Identify Developer Friction Early
Developers spend over half their time just understanding existing code. That's friction most teams never measure. Constant context switching, unclear requirements, and legacy systems all add to cognitive load without anyone noticing.
DevEx metrics catch these problems early. A spike in code churn or a longer feedback loop signals trouble before it turns into missed deadlines. Engineering leaders who track this data can fix root causes instead of reacting to symptoms after the damage is done.
Improve Engineering Productivity
Reducing cognitive load improves developer productivity by 42%. That's a massive jump, and it comes from something simple: fewer distractions and clearer systems.
Too many tools, tangled code complexity, and rising technical debt all create extra mental effort. Developer productivity metrics help engineering teams spot where that mental effort piles up. Platform engineering plays a big role here too. Self-service capabilities and smarter software tools to simplify day-to-day work cut cognitive load and let developers focus on real work instead of fighting their own tools.
Speed Up Software Delivery
Short lead times and frequent deployments double performance goal achievement. That's not a small edge. It's the difference between a team that ships confidently and one stuck in approval bottlenecks.
Lead time for changes and deployment frequency are two of the clearest signals in software delivery. When both improve, code moves through the deployment pipeline faster and with less risk. Teams stop guessing where delays happen and start fixing the actual bottleneck.
Improve Developer Satisfaction And Retention
Developer satisfaction surveys reveal what dashboards can't. Burnout, unclear priorities, and low psychological safety often show up in feedback long before they show up in output.
Engineering leaders who act on this feedback build teams people want to stay on. High developer satisfaction doesn't just feel good. It directly supports better business outcomes, since happy developers write higher-quality software and leave less often.
Connect DevEx To Business Outcomes
Teams with positive DevEx are 33% more likely to meet business goals. Organizations that invest in developer experience see ROI between 151% and 433%.
That's not a soft metric anymore. Each point gained in the Developer Experience Index saves 13 minutes per developer, every week. Multiply that across an entire engineering team, and DevEx stops being a nice-to-have. It becomes a direct line to business value.
8 Developer Experience Metrics You Should Track
Picking the right developer experience metrics means covering more than deployment speed. These 8 metrics balance quantitative data with real developer feedback, giving engineering leaders a full picture of team health.
Metric | What It Measures |
|---|---|
Code Review Turnaround Time | How long a pull request waits before review and approval |
Build And Test Feedback Time | How fast developers get results after running builds or tests |
Deployment Lead Time | Time from commit to live production code |
Developer Satisfaction Score | How developers feel about their tools, workflows, and team |
Cognitive Load Score | Mental effort required to complete daily development tasks |
Developer Flow State | How often developers get uninterrupted blocks of focused work |
Time To First Contribution | How long a new engineer takes to make their first commit |
Developer Focus Time | How much planned work gets interrupted by unplanned tasks |
1. Code Review Turnaround Time
A slow code review process quietly kills momentum. Developers finish a task, then wait. That wait adds up across an entire engineering organization and drags down developer productivity metrics fast.
Tracking this metric shows exactly where code review effectiveness breaks down. Maybe reviewers are overloaded. Maybe requirements were unclear from the start. Either way, shorter turnaround times mean higher code quality and fewer developers stuck waiting on someone else's calendar.
2. Build And Test Feedback Time
Build and Test Speed tracks the duration of feedback loops during coding. The longer that loop runs, the more a developer's focus drifts somewhere else.
Fast feedback loops reduce technical debt by 50% compared to slower responses. That's a huge win for any deployment pipeline. When builds and tests return results quickly, especially with strong software testing strategies, developers catch mistakes while the code is still fresh in their head, not an hour later after context switching to something else.
3. Deployment Lead Time
Lead Time for Changes is the time taken for a commit to reach production. It's one of the clearest engineering KPIs out there, and it tells you a lot about how healthy your deployment pipeline really is.
Deployment Frequency reflects how often code is successfully deployed to production. Pair the two together, and engineering leaders get a full view of software delivery speed. Short lead times mean teams ship value faster, with less risk piling up along the way.
4. Developer Satisfaction Score
Developer Satisfaction is often measured via Net Promoter Score or pulse surveys. Numbers alone can't capture how someone feels about their job, so this metric fills that gap directly.
This fits inside the wider SPACE Framework, which focuses on capturing developers' experiences beyond raw output metrics. The SPACE framework includes Satisfaction, Performance, Activity, Communication, and Efficiency. Tracking satisfaction regularly gives engineering leaders an early warning system before good developers quietly check out.
5. Cognitive Load Score
Cognitive load increases with too many tools and complex architecture. Every extra system a developer has to juggle adds mental effort that has nothing to do with actual problem solving.
This score measures how much mental effort a task really demands. High code complexity, legacy systems, and constant context switching all push this number higher. Lower cognitive load means developers spend their energy writing good code instead of just figuring out where everything lives.
6. Developer Flow State
Flow state enhances productivity and requires uninterrupted work periods. Once a developer gets into deep focus, interruptions cost far more than the few minutes they seem to take.
This metric tracks how often developers actually reach that state without getting pulled away. Meetings, pings, and cross-team dependencies all chip away at flow. Protecting longer blocks of quiet, focused time directly supports better code quality and faster software delivery.
7. Time To First Contribution
Onboarding Time measures how long it takes for a new engineer to make their first commit. It's one of the most honest signals of how healthy an engineering organization really is.
A long wait usually points to poor documentation, a messy developer portal, or an overly complex codebase. Shorter times to first contribution mean new hires ramp up faster and start adding business value sooner, instead of getting stuck reading old code for weeks.
8. Developer Focus Time
Unplanned Work Rate is how frequently developers are interrupted from planned work. Every unplanned request pulls a developer out of what they were actually supposed to be building.
This metric tracks how much real focus time survives a typical day. High interruption rates create pressure, hurt planning quality, and quietly erode developer productivity. Protecting focus time isn't about tracking individual output metrics; it's about fixing team-level workflows that cause the interruptions in the first place.
How To Choose The Right Developer Experience Metrics
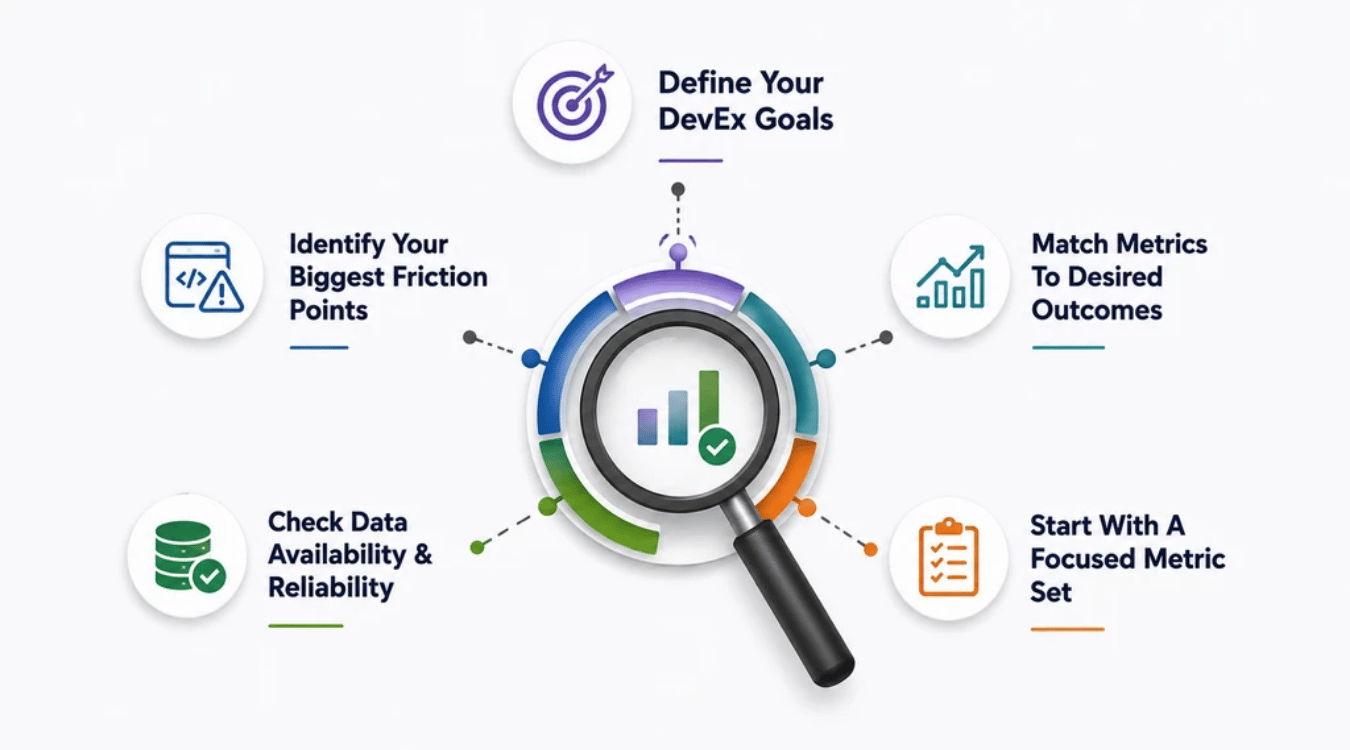
Not every metric fits every team. Picking the right developer experience metrics starts with knowing what problem you're actually solving, then matching key metrics to that goal instead of copying someone else's dashboard.
Define Your DevEx Goals
Before you track anything, ask what you actually want to fix. Slow releases? Low developer satisfaction? High turnover? Your goal shapes which developer metrics matter most.
Vague goals lead to vague metrics, and vague metrics rarely translate to real business impact. Get specific. Maybe you want faster onboarding, or fewer missed deadlines. Once the goal is clear, measuring developer experience becomes a lot simpler. You'll know exactly which numbers actually matter and which ones just create noise, and how engineering team management practices can reinforce those priorities.
Identify Your Biggest Friction Points
Most team performance problems trace back to a handful of pain points. Maybe it's a clunky deployment pipeline. Maybe it's constant context switching. Maybe it's the growing complexity that comes with scaling engineering teams for growth. Talk to your development team before you pick a single metric.
Developers usually know exactly where the friction lives, long before any dashboard shows it. Ask direct technical questions about their daily workflow. Once you identify pain points this way, choosing metrics gets easy. You're no longer guessing. You're measuring something your team already told you was broken.
Match Metrics To Desired Outcomes
A metric only matters if it connects to an outcome you care about. Tracking code coverage means nothing if your real problem is slow deployment lead time. Match the metric to the goal, every time.
This is where a lot of software engineering teams go wrong. They chase individual metrics because they're easy to measure, not because they're useful. Focus on what actually drives most value instead. If the goal is speed, track lead time. If it's quality, track change failure rate, and support both with modern DevOps best practices.
Check Data Availability And Reliability
You can't track what you can't measure well. Before committing to any metric, check whether your systems can actually capture clean, consistent data.
Automate data collection for consistent DevEx metrics wherever possible. Manual tracking gets messy fast, and unreliable numbers create more confusion than clarity. Establish a baseline to understand current DevEx metrics before you set any targets, ideally tied into your broader software development life cycle. Without a baseline, you're comparing progress to nothing, and that makes every result look meaningless.
Start With A Focused Metric Set
Tracking everything at once overwhelms any development team. Start small. Pick two or three team-level metrics tied directly to your biggest friction point, not a giant list of lagging engineering KPIs or future-facing software development trends for 2026 nobody checks.
A focused set drives a real improvement process instead of decision paralysis. Once those metrics stabilize and the team trusts the data, expand from there. Developer experience devex programs succeed when they grow gradually, not when they try to measure every developer action on day one.
How To Combine Quantitative And Qualitative DevEx Metrics
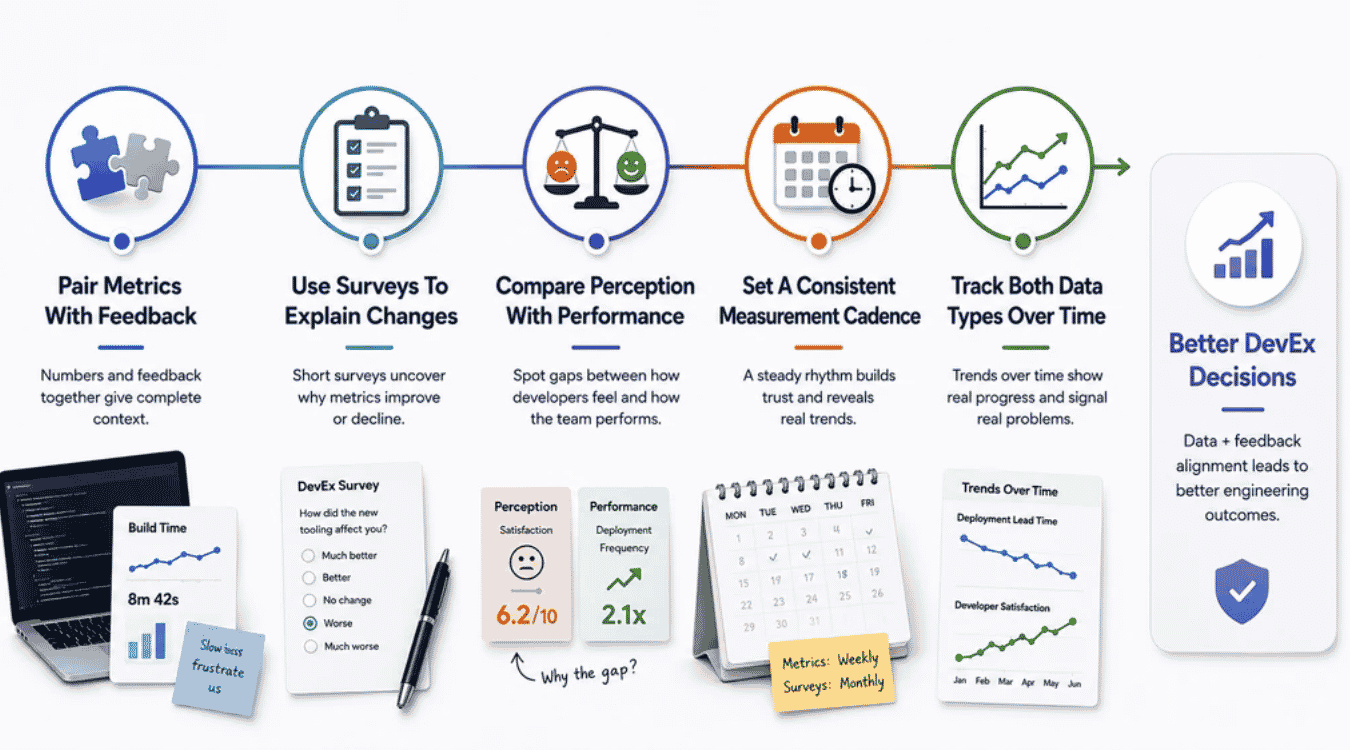
Numbers alone don't tell the full story. The best developer experience programs pair hard data with real developer feedback, so teams understand both what's happening and why it's happening.
Pair System Metrics With Developer Feedback
Automated telemetry provides data about system performance while surveys provide developer perspectives. Neither one works well alone. A dashboard might show slow build times, but only developer feedback explains how that slowness actually feels day to day.
This pairing covers key aspects that pure data misses. Developers with high code understanding report 42% more productivity, but you'd never spot that from system metrics alone. Talk to your team regularly. Their input turns raw numbers into something you can actually act on, especially when you're planning your broader software development timeline.
Use Surveys To Explain Metric Changes
A metric can shift overnight, and you won't always know why. Deployment lead time drops, or developer satisfaction dips. Surveys fill in that gap fast.
Ask short, direct questions right after a change happens. Did a new tool slow people down? Did a process update reduce context switching? Short feedback loops reduce cognitive load and increase innovation, and surveys help you spot that shift before it shows up somewhere else. Without this step, teams often misread what the data actually means.
Compare Perception With Actual Performance
Sometimes developers feel stuck even when the metrics look fine. Other times, morale seems high but outputs translate poorly into real progress. Comparing both sides catches these mismatches early.
This gap often points to something deeper, like unclear requirements or rising technical debt nobody flagged yet. A team missing commitments might still report high satisfaction, which sounds odd until you dig into the actual workflow. Checking perception against performance keeps your developer experience tools honest and your data grounded in reality.
Set A Consistent Measurement Cadence
Random check-ins create messy, unreliable data. Pick a cadence and stick with it. Weekly system metrics paired with monthly surveys work well for most engineering teams.
Consistency matters more than frequency here. A steady rhythm helps you spot real trends instead of one-off spikes. It also builds trust across the development team, since everyone knows measurement isn't a surprise audit. Over time, this rhythm makes every metric easier to read and act on.
Track Both Data Types Over Time
A single snapshot rarely tells you much. Trends matter more. Watching both quantitative and qualitative data over months reveals whether your developer experience is actually improving or just holding steady, particularly across a full startup software development process where each phase introduces different kinds of friction.
This long view also helps separate real progress from noise. A short dip in deployment speed might mean nothing, but a steady decline paired with dropping satisfaction scores signals a real problem. Tracking both data types together gives engineering leaders the clearest possible picture over time.
How To Turn Developer Experience Metrics Into Action
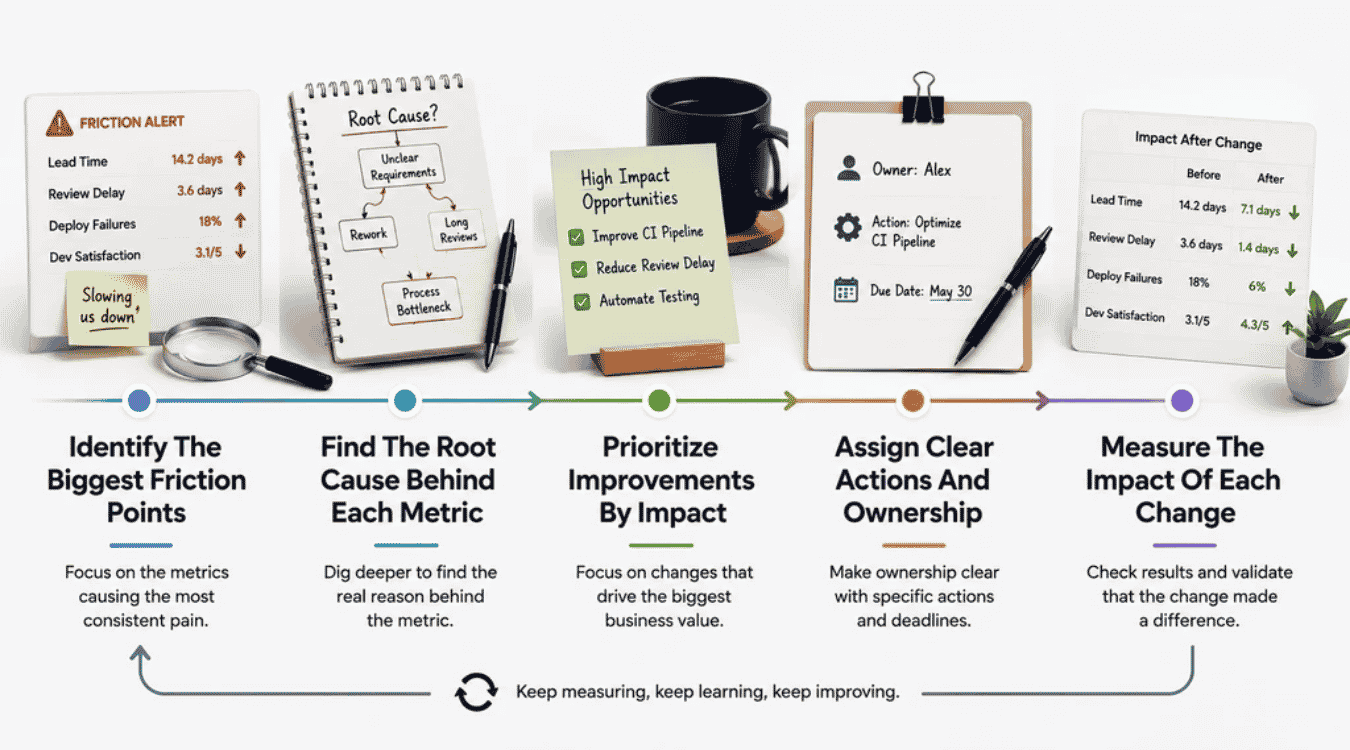
Collecting data means nothing without follow-through. Turning developer experience metrics into real change takes a clear process, from spotting the problem to measuring whether your fix actually worked.
Identify The Biggest Friction Points
Start with the metric that hurts the most. Maybe deployment lead time keeps creeping up. Maybe developer satisfaction scores dropped last quarter. Rank your friction points instead of tackling everything at once.
This step separates real problems from minor annoyances. A team missing commitments repeatedly is a bigger red flag than one slow week. Focus your energy where the data shows the clearest, most consistent pain, not wherever the loudest complaint happened to come from.
Find The Root Cause Behind Each Metric
A slow metric is a symptom, not the disease. Slow code review turnaround might trace back to unclear requirements, not lazy reviewers. Dig past the number before you fix anything.
Ask your development team direct technical questions about the workflow behind the metric. Sometimes the real cause is a tooling gap. Sometimes it's rising code complexity nobody addressed, requiring hard choices between refactor vs rebuild strategies for software teams. Skip this step, and you'll fix the symptom while the actual problem for team performance problems just resurfaces later.
Prioritize Improvements By Impact
Not every fix deserves the same attention. Rank potential changes by business impact, not by how easy they are to ship. A small tweak that saves ten minutes a day beats a big project that saves five.
Top-quartile Developer Experience Index scores correlate with 4 to 5 times better performance, which shows how much impact the right priorities can create. Focus first on changes tied to your biggest friction points. Everything else can wait until those wins land.
Assign Clear Actions And Ownership
A plan without an owner rarely gets done. Every fix needs one person responsible for it, plus a clear deadline. Vague plans create more team performance problems than they solve.
Write down exactly what will change and who owns each developer action. This keeps the improvement process accountable instead of theoretical. When ownership is clear, engineering leaders can check progress without chasing people down or guessing who dropped the ball.
Measure The Impact Of Each Change
Every fix needs a before-and-after check. Did code review turnaround actually drop? Did developer satisfaction move at all? Without this step, you're just guessing whether the change helped.
Compare the metric a few weeks after the fix ships. Small, steady improvement beats a dramatic short-term spike that fades fast. This final check closes the loop and turns your developer experience metrics into a real improvement process instead of a one-time report nobody revisits.
Common Developer Experience Measurement Mistakes To Avoid
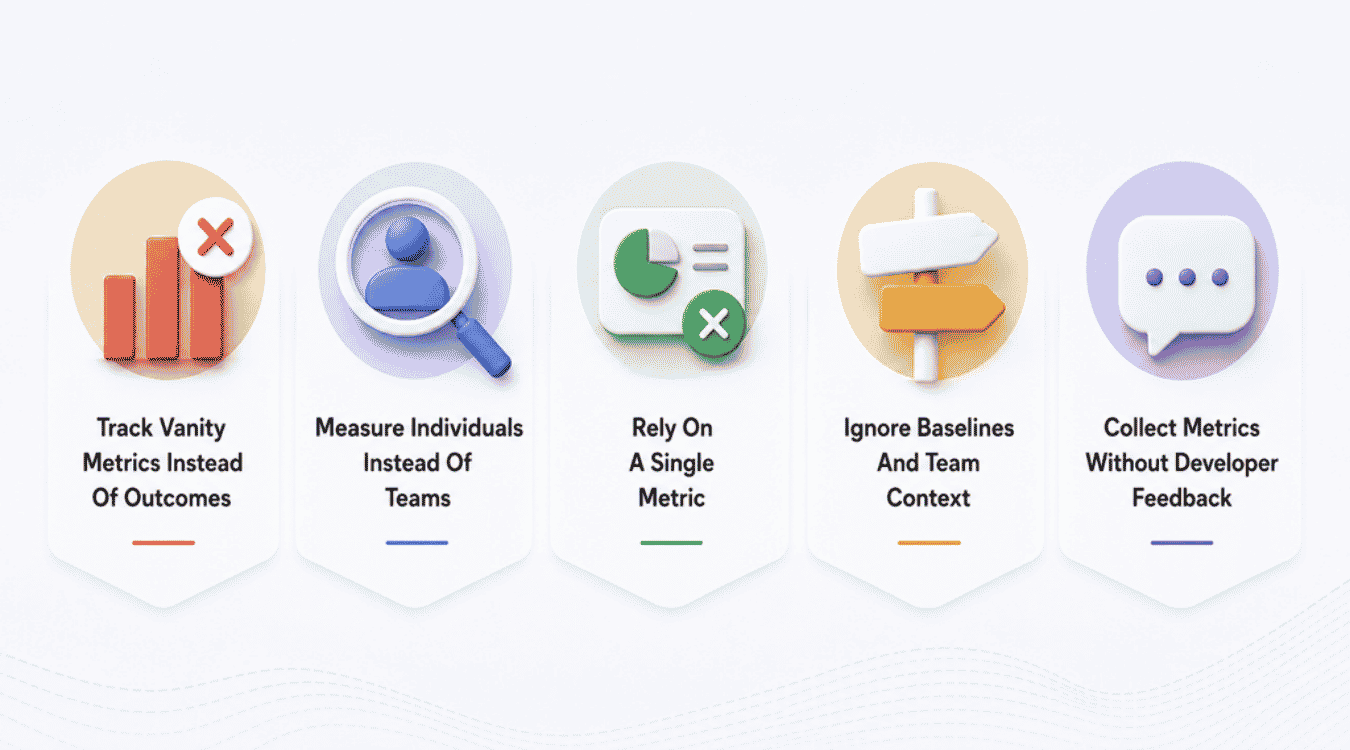
Good intentions don't guarantee good measurement. A lot of engineering teams track the wrong things, then wonder why nothing improves. These five mistakes derail most developer experience metrics programs.
Track Vanity Metrics Instead Of Meaningful Outcomes
Lines of code written looks impressive on a dashboard. It also means almost nothing. More code doesn't mean better code, and it definitely doesn't mean higher productivity.
Vanity metrics feel good because they're easy to count, not because they're useful. Change Failure Rate and Mean Time to Restore Service tell you far more about real software engineering health than raw output ever will. Pick metrics that connect to actual outcomes, not ones that just look busy on a slide.
Measure Individual Developers Instead Of Teams
Judging one developer by their commit count creates the wrong incentives fast. People start gaming individual metrics instead of doing good work. That's the opposite of what any DevEx program should encourage.
Team-level metrics avoid this trap entirely. They measure the development process itself, not the person inside it. A slow code change might reflect unclear requirements, not a slow developer. Keep the focus on the system, and people stop feeling watched and start feeling supported.
Rely On A Single Metric
One number never tells the whole story. A team might have great deployment frequency and still struggle with burnout underneath. Lagging indicators alone hide problems that show up later.
Combine a few key metrics instead. Pair deployment speed with developer satisfaction. Pair code coverage with cognitive load. Software engineering is complex, and one metric can't capture all of it. Multiple signals together give you a far more honest picture of what's actually happening, especially for distributed teams using agile offshore software development models or following an outsource software development strategy.
Ignore Baselines And Team Context
A number means nothing without something to compare it against. A two-day code review turnaround might be great for one team and terrible for another. Context always matters here.
Every team works differently, with different tools, different codebases, and different developer experience tools already in place. Skipping the baseline step leads to unfair comparisons and bad decisions. Set a starting point first, then measure progress against that, not against some other team's numbers.
Collect Metrics Without Developer Feedback
Data without context leads to guessing. A metric might show slow output, but only developer feedback explains whether that's due to unclear requirements, technical questions left unanswered, or something else entirely.
Skipping feedback turns measurement into surveillance instead of improvement. Developers can tell you exactly where the friction lives, often faster than any dashboard can show it. Pair every metric with real conversations, and your developer experience metrics program actually earns trust instead of resentment.
How AI Changes Developer Experience Measurement
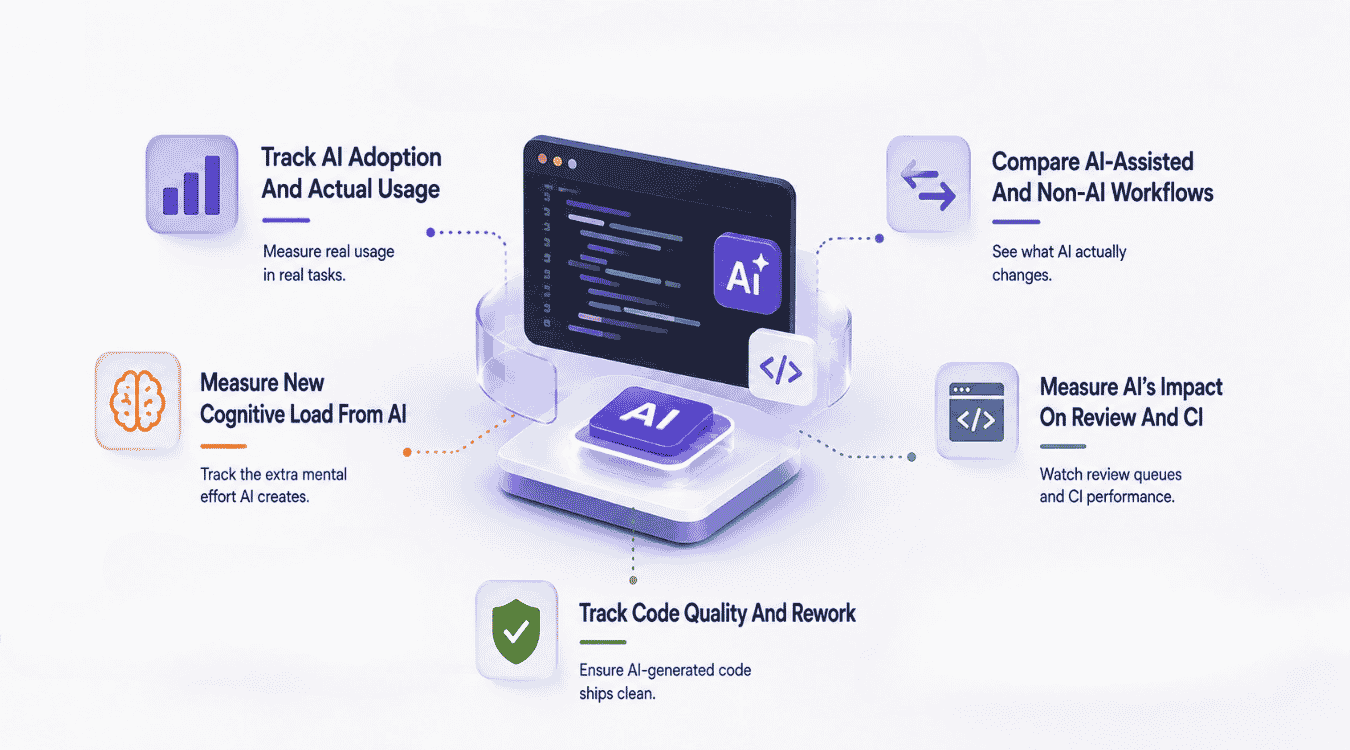
AI agents are changing how developers write, review, and ship code. That shift means old developer experience metrics need a fresh look, since AI touches nearly every step of the development process now, much like the broader shift from AI-driven automation in SaaS and traditional automation to AI automation in other business workflows.
Track AI Adoption And Actual Usage
Not every developer uses AI tools the same way. Some rely on code generation daily. Others barely touch it. Tracking actual usage matters more than tracking who has access.
Adoption numbers alone can mislead you. A license count doesn't show real behavior. Look at how often developers actually use AI agents during real tasks, not just whether the tool sits installed on their machine. This gives engineering leaders a much more honest developer experience index to work from.
Compare AI-Assisted And Non-AI Workflows
Side-by-side comparison tells you what AI actually changes. Does a code change move faster with AI help? Does code review turnaround shift at all? Compare both workflows directly instead of guessing, especially on longer SaaS software development timelines where compounding gains or losses matter.
This comparison often reveals surprises. Some teams see a real boost in productivity from AI in SaaS. Others see the same lead time, just with different bottlenecks. Comparing workflows this way keeps the data honest and stops teams from assuming AI helps just because it feels faster in the moment.
Measure AI’s Impact On Review And CI
AI-generated code still needs a human set of eyes. Track how AI changes code review effectiveness and CI pipeline performance specifically, since this is where a lot of hidden friction shows up.
More code moving through review can slow down build and test feedback time if reviewers get overwhelmed. Watch deployment pipeline metrics closely during this shift. If review queues grow longer even as code generation speeds up, that's a clear sign the review process needs its own fix.
Track Code Quality And Rework
Faster code isn't always better code. Track how much AI-generated code gets reworked after review. High rework rates cancel out any speed gained from code generation in the first place.
Watch code coverage and change failure rate closely here too. If quality drops while output climbs, that's a warning sign, not a win. Real high productivity comes from AI software development that ships clean code the first time, not code that just gets written fast and fixed twice.
Measure New Cognitive Load From AI
AI tools promise to reduce mental effort, but they can add a new kind of cognitive load instead. Developers now have to review, trust, and correct AI suggestions on top of writing code.
This extra layer deserves its own tracking. A developer might feel busier, not more productive, if they're constantly checking AI output line by line. Measuring this new cognitive load keeps your developer experience metrics accurate as AI adoption grows across the entire engineering organization and as teams make MVP feature prioritization decisions that depend on realistic capacity estimates.
Final Thoughts
Developer experience metrics aren't about watching developers more closely. They're about fixing the systems developers work inside every day. Feedback loops, cognitive load, and flow state shape real output far more than any line-of-code count ever will.
Start small. Pick a few metrics tied to your biggest friction points, pair that data with real developer feedback, and set a consistent cadence for checking both. Skip the vanity numbers. Skip judging individuals instead of teams.
The payoff is real. Teams with strong developer experience are far more likely to hit business goals, ship faster, and keep good developers around longer. AI is only raising the stakes here, making thoughtful measurement more important, not less. Get the fundamentals right, and everything else gets easier.