
How To Calculate Technical Debt Ratio (Formula + Benchmarks)

by Rhea Collins | Aug 12, 2026
Table of Contents
- What Is Technical Debt Ratio
- How To Calculate Technical Debt Ratio
- Technical Debt Ratio Benchmarks
- How Often To Measure Technical Debt Ratio
- Technical Debt Ratio In SonarQube
- Tools To Measure Technical Debt Ratio
- Metrics That Support Technical Debt Ratio
- How To Reduce A High Technical Debt Ratio
- Technical Debt Ratio In Software Due Diligence
- Final Discussions
A team burning through sprint after sprint on bug fixes instead of features usually has a number attached to that pain. Technical debt ratio puts a percentage on how much your codebase is costing you compared to what it took to build. Engineering leaders use it to answer a question executives actually care about: how much of our capacity goes toward fixing old problems instead of shipping new ones.
SonarQube and similar tools calculate it automatically, but knowing the formula behind the number matters just as much as the tool spitting it out. Below, you'll find the exact calculation, benchmarks by company stage and codebase size, and the tools engineering teams use to track it over time.
What Is Technical Debt Ratio
Technical debt ratio measures the cost of fixing your codebase against the cost of building it in the first place. Managing technical debt starts with putting a number on it, and this ratio does exactly that. Similar to financial debt, it grows quietly until remediation work outpaces new development.
Not all technical debt is bad debt though. Accumulated technical debt often reflects reasonable tradeoffs made under deadline pressure. Tracking the ratio helps teams reduce technical debt strategically while protecting code quality and shipping speed.
How To Calculate Technical Debt Ratio
Calculating technical debt ratio starts with a formula borrowed from the SQALE method, used across technical debt management practices worldwide. Here's how technical debt measurement works in practice, plus a worked example and how the ratio shifts on new code.
SQALE Remediation Formula
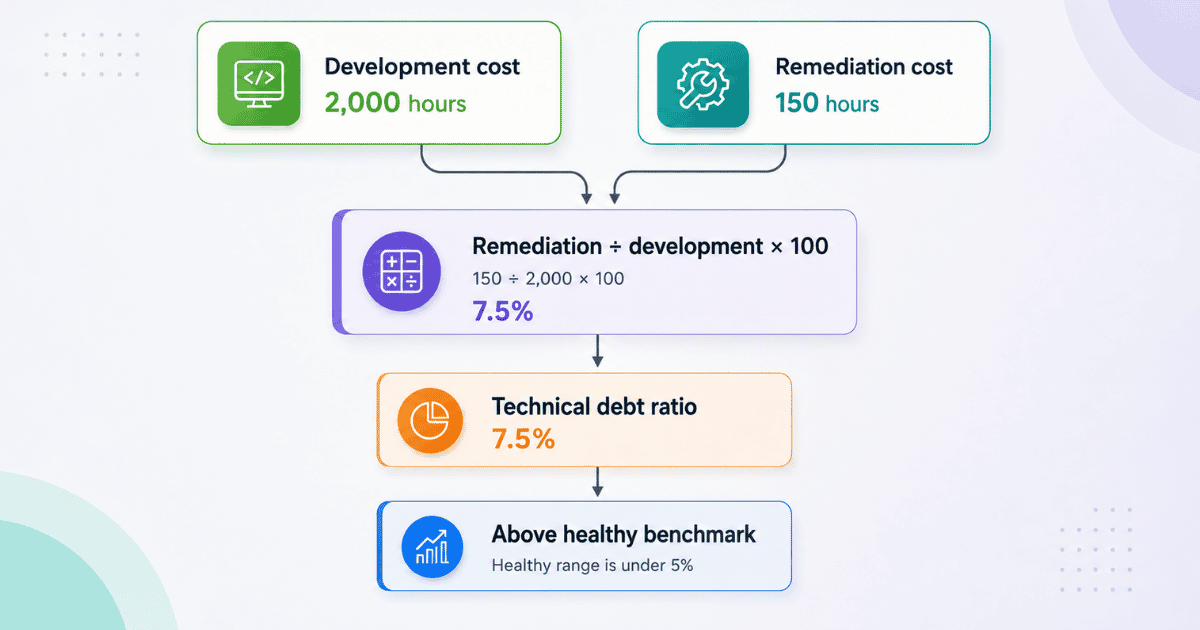
The SQALE method defines technical debt ratio as remediation cost divided by development cost, multiplied by one hundred. Remediation cost covers the hours needed to fix technical debt, including bugs, code smells, security issues, and structural problems flagged by static analysis tools. Development cost reflects the total effort spent building the current codebase from the ground up.
This formula turns a vague sense that technical debt exists into a number leadership can act on. Teams track technical debt ratio alongside other technical debt metrics to see whether reduction efforts are actually working or falling behind new shortcuts.
Worked Calculation Example
Picture a team that spent 2,000 hours building a feature module over the past year. Static analysis tools estimate 150 hours are needed to fix technical debt in that same module, covering code debt like duplicated logic, missing tests, and outdated dependencies that slow every future change.
Divide 150 by 2,000, then multiply by one hundred. That gives a technical debt ratio of 7.5 percent, above the healthy five percent benchmark most teams aim for. This kind of technical debt measurement tells the team exactly how much capacity debt reduction would free up next quarter, turning an abstract worry into a budget line.
Technical Debt Ratio On New Code
Technical debt ratio on new code measures something different from the formula above: how much debt a team creates right now, not what already exists across the entire codebase. Track technical debt on new code by comparing bug-fix and refactoring commits against feature commits within a single sprint.
A high ratio here signals technical debt management is slipping in real time, not just accumulating from old decisions made years ago. Catching this early makes technical debt reduction cheaper than waiting until the next full measurement cycle reveals how technical debt has quietly piled up, and it can inform whether a refactor vs rebuild approach is the right remediation path.
Technical Debt Ratio Benchmarks
Most industry sources agree on the same range for technical debt ratio TDR, even though software projects vary wildly in size and age. Anything under five percent counts as healthy. Anything above ten percent means development teams are spending real capacity fighting old decisions instead of shipping new work.
Healthy Ratio Under Five Percent
A ratio under five percent means tech debt exists but stays manageable. The technical debt metaphor holds well here: interest payments are small enough that they don't eat into the budget for new features. Teams at this level usually catch problems early through code review and static analysis before they compound.
Once a team crosses into double digits, technical debt accumulates faster than it gets paid down. Interest payments grow heavier each sprint, and refactoring starts competing directly with roadmap commitments instead of running quietly alongside them.
Benchmarks By Company Stage
Early-stage startups often run TDR above ten percent on purpose. Shipping fast to validate an idea matters more than clean code when nobody knows yet if the product will survive. This is intentional tech debt, not neglect.
Scaling companies with paying customers should tighten toward the five percent range, since outages and slow releases start costing real revenue, which puts pressure on engineering team management for faster product delivery. Enterprise software projects with legacy systems sometimes accept a higher baseline permanently, as long as development teams track the ratio and prevent it from climbing further.
How Often To Measure Technical Debt Ratio
Measuring once a year tells a technical team too little too late. Technical debt ratio needs a regular cadence built into the development process, not a one-time checkup, so debt exists as a tracked number rather than a vague worry everyone mentions in standups.
A practical cadence looks like this:
- Every sprint: Run static analysis tools against new commits to catch debt before it compounds, especially during heavy feature development phases.
- Monthly: Recalculate the ratio against total development cost so far, watching for drift rather than reacting to a single bad number.
- Quarterly: Compare trends against total development effort across the whole codebase, not just recent sprints, to catch slower-moving architectural debt.
- After major releases: Re-baseline immediately, since shipped features shift both remediation and development totals at once.
Technical Debt Ratio In SonarQube
SonarQube calculates technical debt ratio automatically during every scan, using the financial metaphor at its core: remediation effort divided by development effort. The platform flags bugs, code smells, and vulnerabilities across existing systems, then estimates the hours needed to fix each one.
A software team gets this number without manual tracking. SonarQube pulls it straight from static analysis, comparing what it costs to fix flagged issues against what it took to build the code originally. This removes guesswork from software development planning.
Ignoring the ratio here has real consequences. Increased maintenance costs pile up quietly, and system failure risk climbs as unresolved issues sit untouched. Poor knowledge transfer compounds the problem, since new engineers inherit flagged issues without context on why they exist. Every fix is a trade-off between shipping speed and long-term stability, one that directly affects business operations beyond the engineering team.
Tools To Measure Technical Debt Ratio
Calculating TDR by hand works for small teams, but most rely on automated tools once codebases grow. Each platform below estimates the implied cost of quick solutions differently, so picking one depends on what your team already tracks.
CodeClimate And Codacy
Both platforms scan repositories and surface code smells alongside key metrics like duplication and test coverage. Codacy assigns letter grades per file, while CodeClimate estimates remediation time directly, which feeds straight into the TDR formula without extra math.
Neither tool requires deep setup. Connect a repo, and code complexity scores start appearing on the first scan. Teams already using either platform for code review don't need a separate tool just for debt tracking.
Snyk Code Analysis
Snyk built its reputation on security scanning, but its code analysis also flags maintainability issues using the same logic as dedicated debt tools. Automated tools like this catch problems developers might miss during a rushed pull request review.
This matters most for teams already paying for Snyk's security features. Getting technical debt visibility as a byproduct of existing security scans means no new subscription and no new dashboard to check.
LinearB Engineering Metrics
LinearB focuses on development velocity rather than static code analysis, showing how much time developers spend on maintenance versus new feature work. This save time angle makes it useful for teams who want business context, not just a percentage, particularly when coordinating remote engineering team management across time zones.
Engineering leaders use LinearB to justify debt reduction sprints with data instead of anecdotes. It answers a different question than SonarQube: not how much debt exists, but how much it's actively slowing the team down.
GitHub And GitLab Insights
Teams already living inside GitHub or GitLab can pull signals for new development without adopting another platform. Pull request cycle time, review delays, and documentation gaps all hint at where debt is accumulating and where deployment frequency improvements might be needed.
This won't calculate a precise TDR percentage, but it flags the same problem areas dedicated tools would surface and can feed into a broader technical debt management strategy. For smaller teams, this built-in data is often enough before justifying a paid tool.
Custom Engineering Dashboards
Some teams build their own dashboards pulling from multiple sources, tailored to metrics that matter for their specific stack. This works well for translating technical debt into terms non technical stakeholders actually understand and for planning how to reduce technical debt faster without slowing delivery.
The tradeoff is maintenance overhead. A custom dashboard needs its own upkeep, and development speed gains from centralized visibility can get eaten up by the effort of keeping the dashboard itself accurate.
Metrics That Support Technical Debt Ratio
TDR gives you one number, but quantitative metrics around it explain why that number moves. As systems evolve and business requirements shift, these five metrics catch the details a single percentage can't show, especially when combined with broader engineering KPIs for software delivery performance.
Code Churn Rate
Code churn tracks how often the same files get rewritten shortly after being committed. High churn usually means a section of code doesn't match business requirements yet, forcing repeated changes instead of one clean implementation. Track this alongside TDR to catch instability before it shows up as a bigger remediation cost later.
Cyclomatic Complexity
This metric counts the number of independent paths through a function or module. Higher complexity means more places for bugs to hide and more effort needed for refactoring efforts down the line. Code with high complexity scores tends to drive additional rework every time someone touches it, which is exactly what TDR is trying to capture in dollar terms.
Defect Ratio
Defect ratio compares the number of bugs found against the size of the codebase. A rising defect ratio often signals that test coverage hasn't kept pace as systems evolve, leaving gaps where problems slip through unnoticed until they hit production.
Code Duplication Percentage
Duplicated code multiplies the cost of every future change, since fixing one bug means finding and fixing it in every copy. This metric has a direct business impact because it inflates both the time and risk tied to routine updates.
Maintainability Rating
SonarQube and similar tools assign a letter grade based on estimated remediation cost relative to codebase size. This rating gives non-technical stakeholders a quick read on code health without needing to understand the underlying quantitative metrics behind it.
How To Reduce A High Technical Debt Ratio
A high TDR doesn't fix itself, and waiting only makes slow delivery worse. The five approaches below target the ratio directly instead of re-explaining every type of technical debt already covered elsewhere on the site, including code behind revenue-critical initiatives like an API monetization strategy and pricing models.
Prioritize By Remediation Cost
Not every flagged issue deserves the whole team's attention right away. Rank items by remediation cost against risk, then tackle whatever causes the most drag on future changes first instead of working through the backlog in whatever order it was logged.
This gives engineering leads a clear understanding of where effort actually pays off. A cheap fix sitting in a rarely touched file matters far less than an expensive one blocking new features every sprint.
Shrink The Development Cost Denominator
TDR moves in two directions, though most teams only think about cutting remediation cost. Growing development effort through new features lowers the ratio too, since the formula compares remediation against total development, not remediation in isolation.
Balance both sides instead of treating debt reduction as the only lever available. A quarter with heavy feature shipping can improve TDR even without touching a single flagged issue, simply by growing the denominator.
Automate Fixes With CodeFix Tools
Manual remediation is time consuming, especially for repetitive issues like design debt scattered across dozens of files following the same bad pattern. Fixing each instance by hand burns hours that could go toward new development.
AI-assisted CodeFix tools handle these patterns automatically, applying the same fix across every flagged file in minutes. This frees developers to focus on changes that actually require judgment instead of repetitive cleanup work.
Set A Target Ratio Per Quarter
A vague goal to "reduce debt" rarely works because nobody agrees on what success looks like. Setting a specific target, like moving from eight percent to five percent this quarter, gives the whole team something concrete to work toward.
This supports long term sustainability instead of one-off cleanup sprints that fade once the next deadline hits. Targets also make it easier to justify dedicated sprint capacity to leadership, especially as software development trends shaping 2026 push teams toward more complex architectures.
Track Ratio Trends Over Time
A single measurement tells you where you stand today, not whether things are improving or getting worse. Tracking the trend across quarters turns TDR from a snapshot into a signal leadership can actually act on.
This supports informed decisions about where to invest engineering time next quarter, and shows whether past remediation efforts actually worked or just kept pace with new debt piling up.
Technical Debt Ratio In Software Due Diligence
Investors and acquirers rarely take a founder's word on code quality. Technical debt ratio gives due diligence teams a number they can actually verify, instead of relying on a demo that hides what's underneath. A target company claiming clean architecture should be able to produce a TDR from SonarQube or a similar tool within hours, not weeks.
This matters most in the weeks before a term sheet closes. A ratio creeping past ten percent signals hidden remediation costs that could eat into the deal's projected returns, especially if key engineers leave right after acquisition. Buyers increasingly ask for this figure alongside deployment frequency and test coverage during technical due diligence checklists.
Sellers benefit too. A documented TDR under five percent, tracked consistently over time, becomes proof of engineering discipline rather than a claim nobody can check. It shortens the diligence timeline and often strengthens negotiating position on valuation when paired with solid technical due diligence checklists.
Final Discussions
Technical debt ratio turns a vague engineering worry into a number leadership can actually plan around. Teams that track it consistently catch problems while they're still cheap to fix, long before a ten percent ratio starts eating into sprint capacity or scaring off a potential acquirer.
Nobody expects a zero percent ratio, and chasing one usually wastes more time than it saves. What matters is knowing where you stand, watching the trend, and deciding deliberately when debt is worth carrying versus when it's time to pay it down.
Pair TDR with the tools and metrics covered above, set a target each quarter, and revisit it during your regular technical debt audits. That habit alone puts most teams ahead of where they started, especially for organizations relying on developer portals to drive API adoption.